Chart Guide

How to read and combine the gold options charts (CME GC/OG) in daily analysis.

All times are Chicago time (CT). A CME session runs 17:00 → 16:00 CT the next day; the market is closed 16:00–17:00 CT. The charts describe positioning and order flow; they are not entry signals.

Notation: L = Long, S = Short, U = Unknown (OI that cannot be attributed), Γ = gamma, F = futures price, “aggressor” = the side sending the market order, “passive side” = the side whose resting order was filled.

Four GEX sign conventions

ConventionFormulaUsed inHow to read
Passive sideLong − Short position GEX, passive side's signPassive GEX Profile · Max ±GEX stars · Gamma Flip dot · Quantum (pivot, OI walls) · the rest of the Advanced tabPositive = the liquidity-providing side is long gamma (hedges against the move). Negative = short gamma (hedges with the move).
Aggressor side, from OILong − Short position GEX, aggressor side's signAggressor NET d+OI GEXOpposite sign to the passive side. Steps only when CME publishes OI.
Aggressor side, today's volumeGEX of session trades, aggressor side's signIntraday Net GEXBuying an option +, selling −, calls and puts alike. Session trades only, no OI.
By contract typecalls −, puts + on total OIGEX Profile LegacyThe common convention, with no position information. Kept for reference; do not use it for direction.

Tab · Market Overview

Options positioning by strike: OI split into Long/Short/Unknown, position-weighted GEX, the Gamma Flip level, and OI change from the latest publication. Read this tab first every day.

01

Gold vs 10Y yields

01 · Gold vs 10Y yieldsMarket Overview
Screenshot of Gold vs 10Y yieldsEnlarge×
What it shows
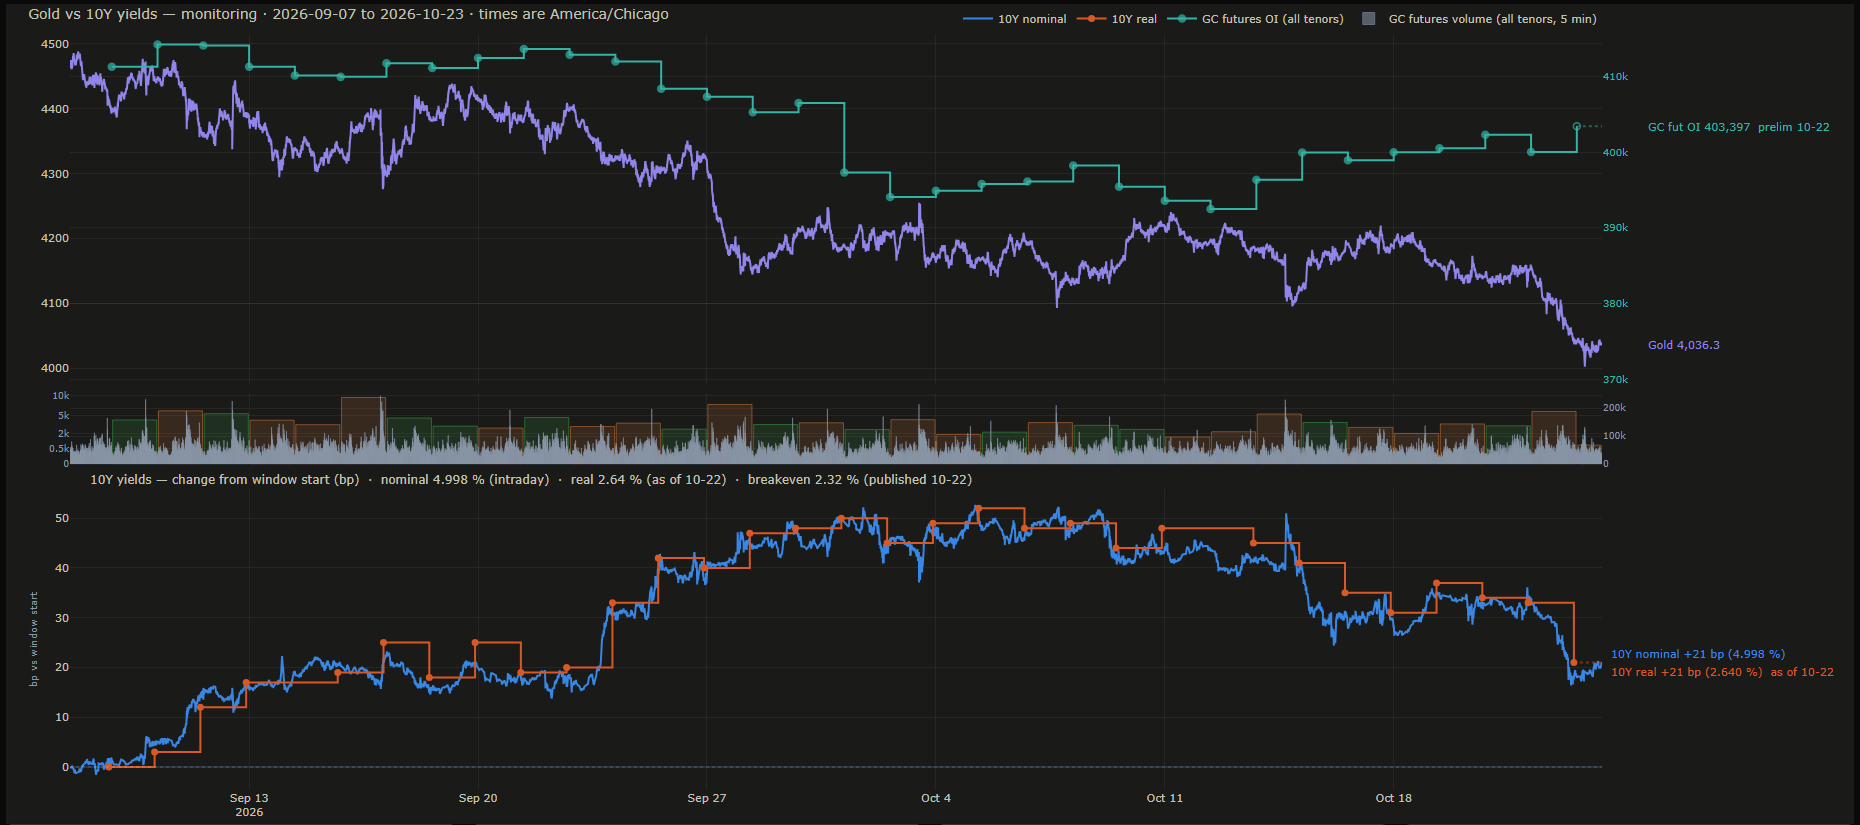
About six weeks of macro context: 1-minute gold price (purple), GC futures OI across all tenors (teal steps, right axis), 5-minute futures volume (bars), and the US 10-year nominal yield intraday (blue) with the daily real yield (orange steps).
How to read it
The lower panel is in basis points from the start of the window, so both yield lines start at 0. Rising real yields usually go with pressure on gold; compare the orange line with the price line above. Futures OI stepping up while price falls means new positions opened on the way down (and the reverse).
How it is calculated
Gold price and futures OI come from CME data; the nominal 10-year yield comes straight from CME's 10-year yield contract, so it updates intraday. The real yield is published daily only and is drawn as steps from its publication time. Both panels share one time axis.
Watch out for
The real yield is a DAILY figure with a 1–2 business day publication lag; the right-hand label shows its "as of" date. The footer turns red when the real-yield source is more than 5 days old.

03

OI & Volume Heatmap

03 · OI & Volume HeatmapMarket Overview
Screenshot of OI & Volume HeatmapEnlarge×
What it shows
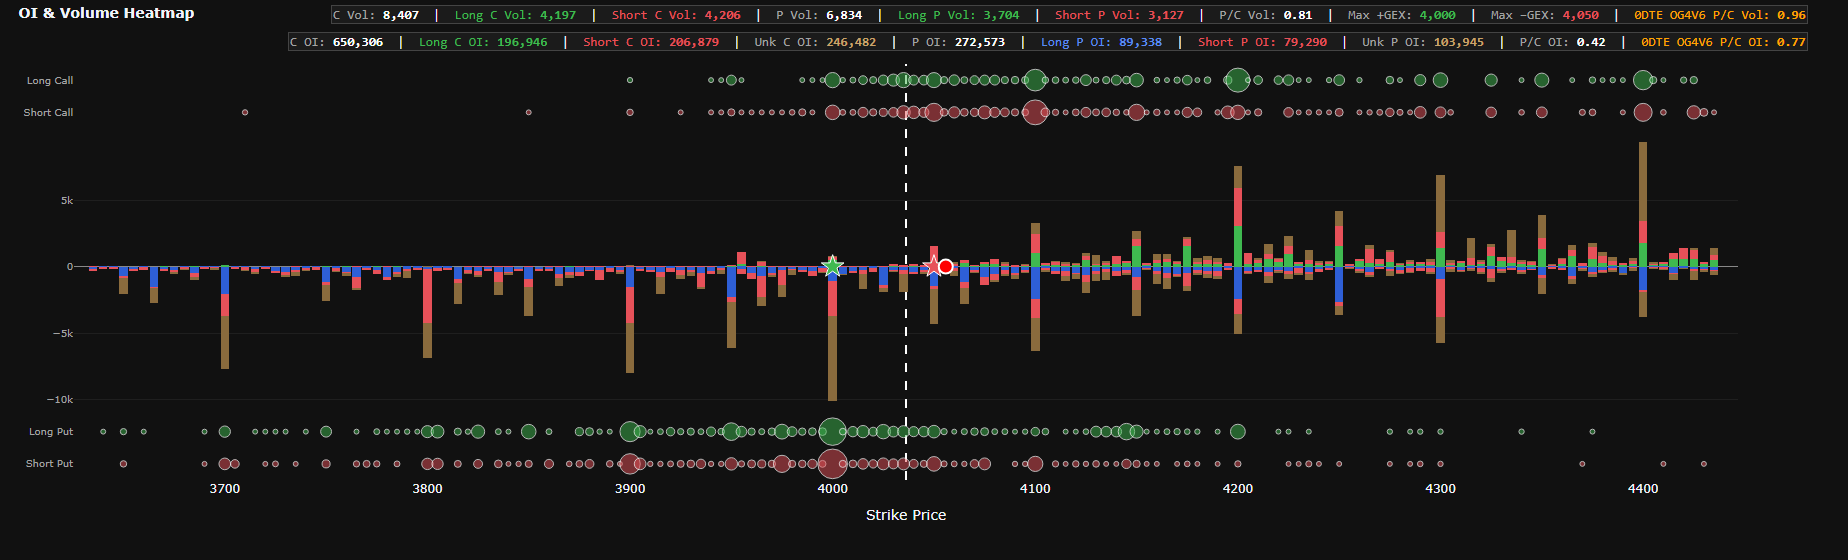
Open interest per strike split into Long / Short / Unknown (middle bars: calls up, puts down) and the live session's aggressor volume (bubbles: Long/Short Call rows on top, Long/Short Put rows at the bottom). Two rows of figures: row 1 is session volume, row 2 is OI.
How to read it
Tall bars are strikes where positions concentrate. Green (Long Call) / cobalt (Long Put) is OI opened by aggressive BUYERS; red was opened by aggressive SELLERS; brown cannot be attributed. Bubbles show who is hitting which strike today: a large Long Call bubble at a high strike means aggressive call buying. The dashed white line is the Reference Price; the green/red stars are the strikes with the largest positive/negative Net GEX d+OI; the red dot with a white rim is the Gamma Flip. The last (orange) box on each row is the 0DTE expiry's P/C.
How it is calculated
OI is the latest CME publication. LevelQuants estimates the share of OI opened by aggressive buyers (Long) and aggressive sellers (Short) from trading history; what cannot be attributed is kept as Unknown, so Long + Short + Unknown = OI. Bubbles are the live session's volume split by the aggressor side. The strike window is Reference ± 10%.
Watch out for
OI is a snapshot of the latest publication (preliminary ~19:30 CT, final ~09:05 CT), not intraday OI. Unknown is about 38% of OI (at capture: 246,482 of 650,306 calls), so do not read Long/Short as the whole market. Very tall bars are capped and their true size is printed in gold (e.g. ▲12.3k). A gold "Directional volume unavailable" line means directional volume for this session is not ready yet.

04

Passive GEX Profile with Risk Zones

04 · Passive GEX Profile with Risk ZonesMarket Overview
Screenshot of Passive GEX Profile with Risk ZonesEnlarge×
What it shows
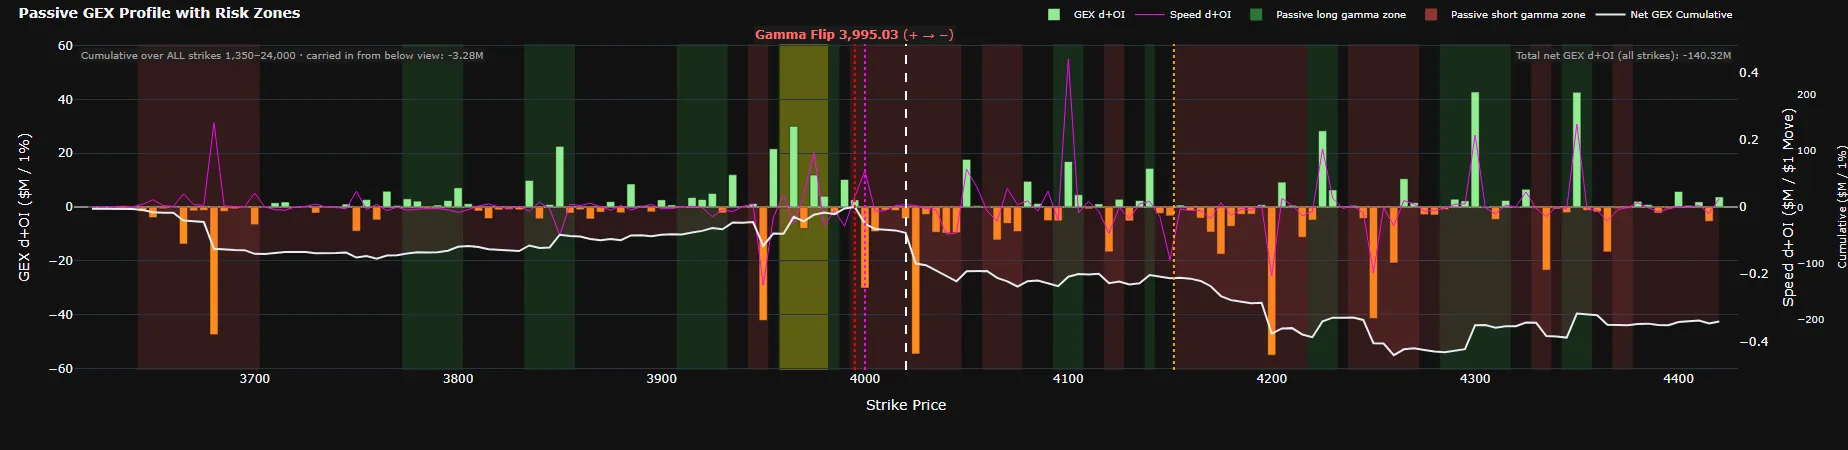
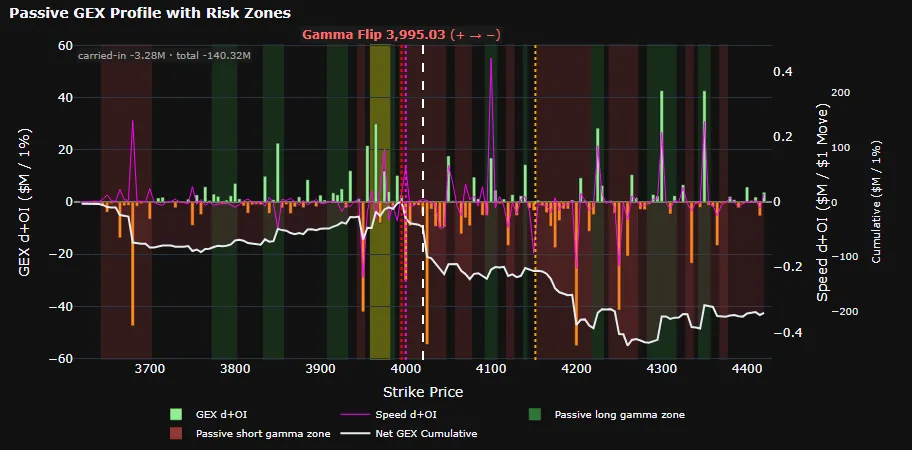
Gamma exposure per strike for the PASSIVE side, weighted by the split Long − Short position (d+OI), with a Speed line, a Net GEX Cumulative line, and the Zero GEX, Gamma Gravity, Gamma Flip and Pin levels.
How to read it
Light-green bars = the passive side is long gamma at that strike (their hedging leans against price moves); orange bars = short gamma (hedging goes with the move and can amplify it). The background is shaded from the bars' profile after smoothing: green (Passive long gamma zone) = the passive side is long gamma over that price range, so the range tends to be held; red (Passive short gamma zone) = short gamma, so volatility extends more easily; unshaded = close to balanced. The colours show the gamma state only, not price direction or buying and selling. The zone the dashed white line (Reference Price) sits in is the passive side's gamma state at price; on the current profile, the farther the zone's edges are from price, the farther price must travel before the state changes. The gold band (Pinning Zone) marks the nearest positive peak of the smoothed profile, inside a green zone; it is not drawn when there is no such peak near price. The white line accumulates from low strikes upward: where it crosses from positive to negative nearest the price is the Gamma Flip (red line, labelled at the top) — a structural level for all positions combined, not the edge of the state at price. In the screenshot, price at 4,020.2 sits above the Gamma Flip at 3,995.03 yet inside a red zone: the passive side is short gamma at price. The dotted magenta line (Zero GEX Level) is the strike nearest price where the unsmoothed bars change sign. The top-left box shows the cumulative amount carried in from below the view; the top-right box shows total Net GEX d+OI over all strikes — the net figure for all positions combined, which can have the opposite sign to the zone around price, since that zone only describes the positions near price (where gamma is largest).
How it is calculated
GEX per strike = Γ × 100 × F² × 1% times the net Long − Short position (instead of total OI), with the passive side's sign. Gamma and price update continuously; positions update at each CME OI publication. The cumulative line and the Gamma Flip use every strike, including those outside the view. The green/red zones follow the bars' profile (every expiry, 0DTE included) after smoothing; stretches too close to zero relative to the largest part in view are left blank. Units: $M per 1% price move.
Watch out for
Unknown is not plotted, so the sign of the total can change once Unknown resolves to one side. (L − S) only changes when CME publishes OI; between publications the chart drifts with gamma and price only. A title of just "GEX Profile with Risk Zones" (no "Passive") means the legacy fallback is showing. The sign here is the OPPOSITE of Aggressor NET d+OI GEX on the Volatility & Flow tab. Read the gamma state at price from the green/red zones, not from where price sits relative to the Gamma Flip; the Gamma Flip here and the Gamma-Flip band on Quantum are computed in two different ways and can sit at different prices. The faint green/red fill between the white line and zero only shows whether the running total is positive or negative; it is not a state zone (state zones fill the full height of the chart). Long gamma going with narrower ranges and short gamma with larger moves is an average tendency, documented mainly in US stocks and stock indices, with no published study of gold yet; macro news can override it completely.

05

OI Change & EOD Volume

05 · OI Change & EOD VolumeMarket Overview
Screenshot of OI Change & EOD VolumeEnlarge×
What it shows
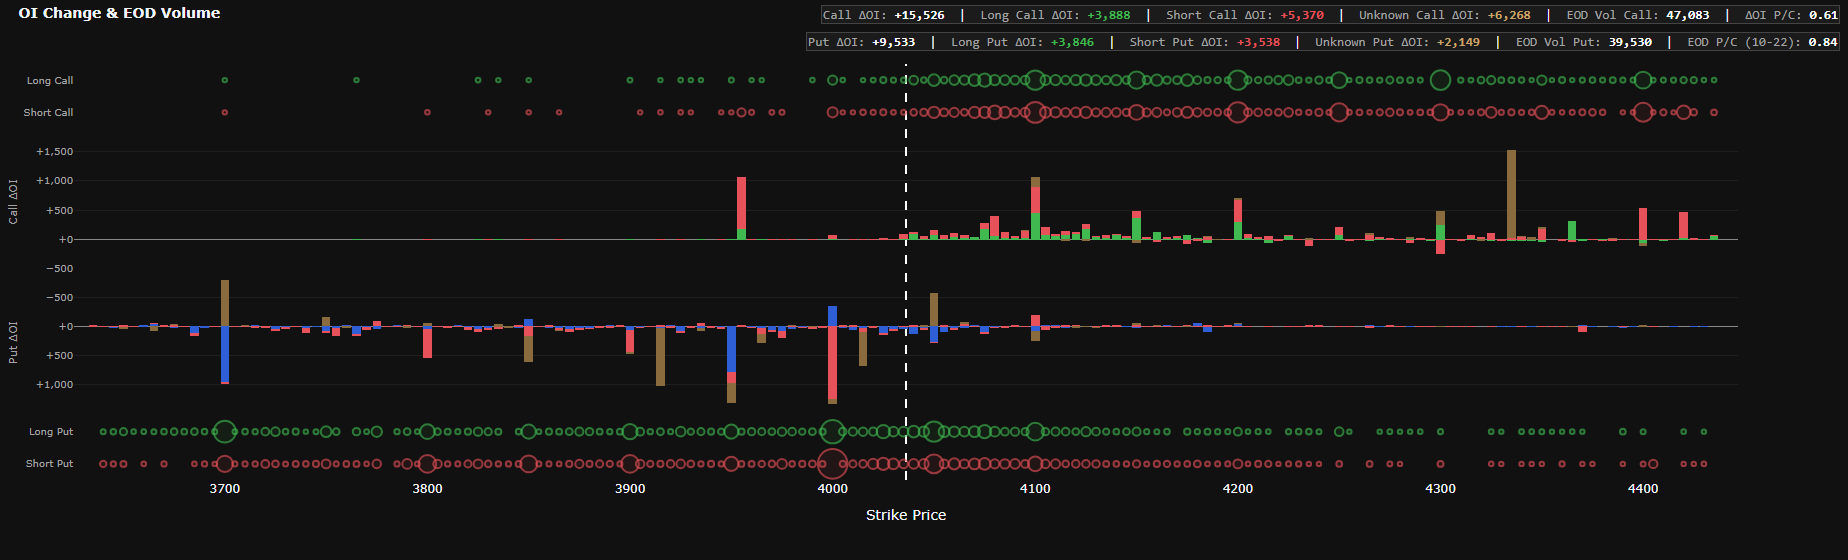
OI change (ΔOI) per strike from the latest publication, split into Long / Short / Unknown; the Call panel is on top, the Put panel below. Hollow bubbles are the aggressor volume of that same ΔOI session.
How to read it
The Put panel's axis is REVERSED: an OI increase points down. Green = new positions opened by aggressive buyers; red = by aggressive sellers; brown = unattributed. Read it with the EOD bubbles: a large ΔOI with little volume often means transfers or block trades away from the tape. Header figures: total ΔOI, Long/Short/Unknown ΔOI, EOD Vol, ΔOI P/C, EOD P/C.
How it is calculated
ΔOI per strike between two publications, split the same way as the OI chart: opened by aggressive buyers, by aggressive sellers, and unattributed; the three parts add up exactly to ΔOI. Bubbles are that session's aggressor volume.
Watch out for
ΔOI belongs to the previous PUBLISHED session, not today. Right after a CME publication there can be a delay before the Long/Short/Unknown split updates; the first row then starts with a gold "split YYYY-MM-DD:" prefix showing the split's session. ΔOI P/C uses absolute values, so the sign is lost.

06

GEX Profile Legacy

06 · GEX Profile LegacyMarket Overview
Screenshot of GEX Profile LegacyEnlarge×
What it shows
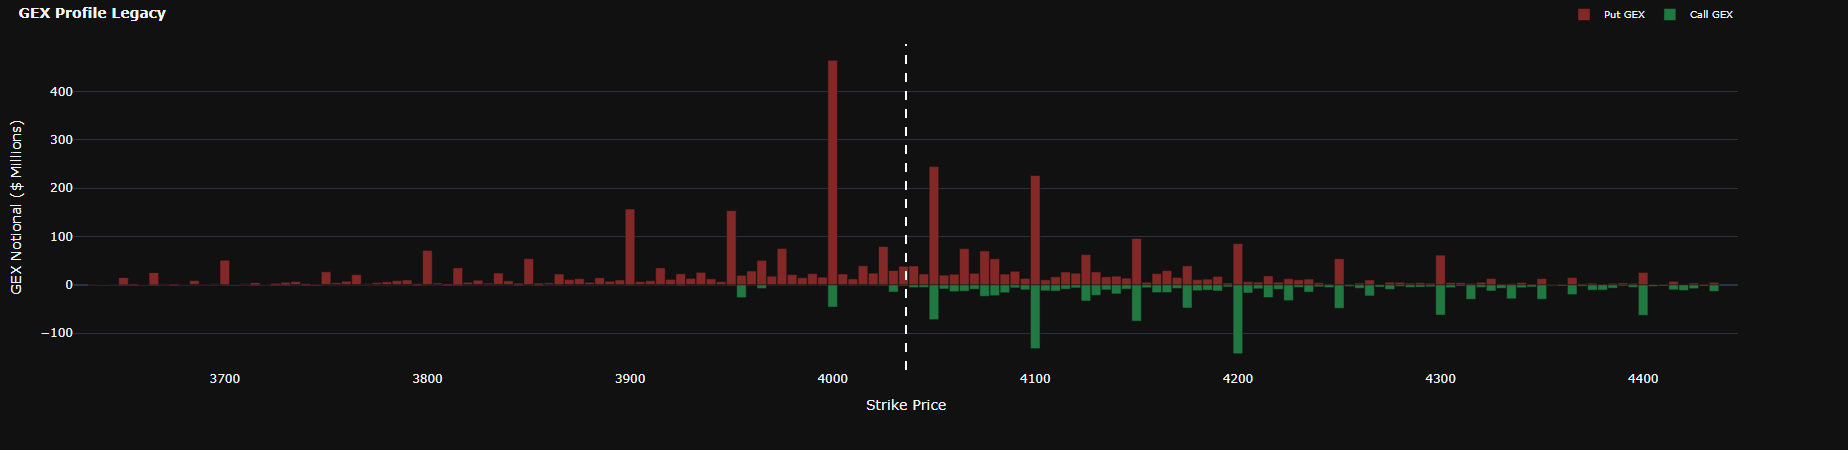
Old-style GEX per strike: put bars red and positive, call bars green and negative.
How to read it
Use it only to compare with outside sources that use the common convention. Bar height tells you which strikes carry a lot of gamma × OI, but the SIGN carries no positioning information.
How it is calculated
GEX = Γ × OI × 100 × F² × 1%, with calls negative and puts positive under the common convention (dealers assumed short calls, long puts), using total OI.
Watch out for
Can have the opposite sign to the Passive GEX Profile at the same strike. When the two disagree, trust the Passive GEX Profile, which is based on actual positions.

Tab · Volatility & Flow

Intraday aggressor flow (premium, delta, gamma) and every volatility gauge: RR, BF and ATM IV by expiry, VRP, smiles, and the wing z-score map.

07

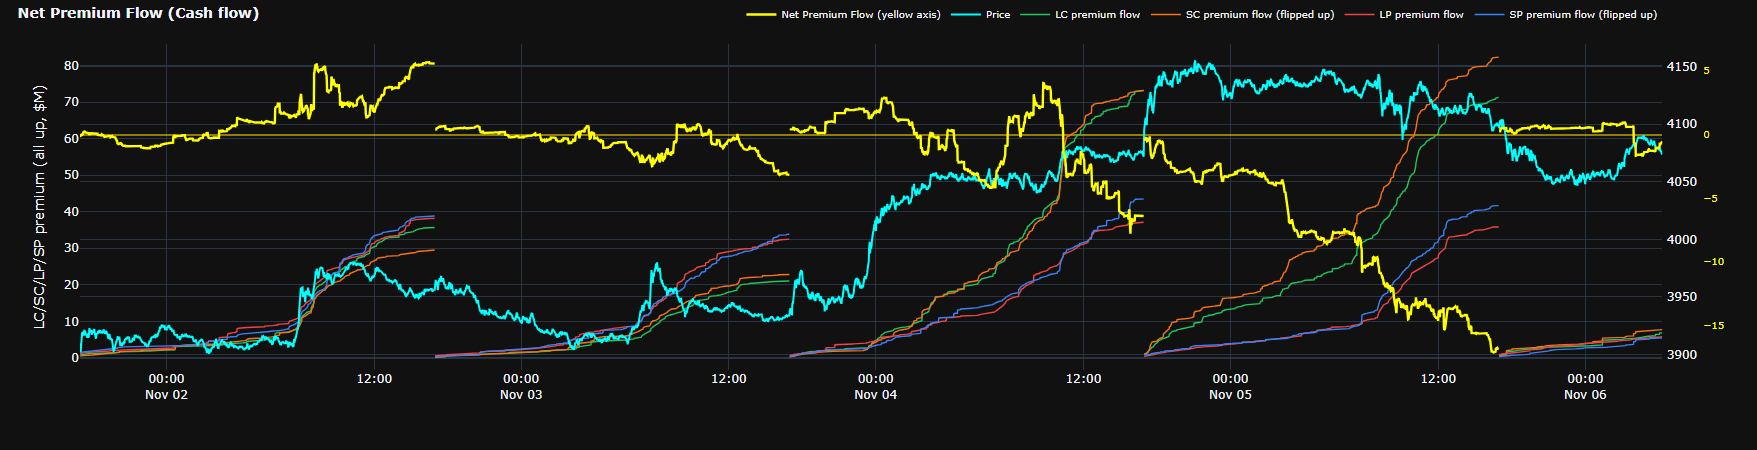
Net Premium Flow (Cash flow)

07 · Net Premium Flow (Cash flow)Volatility & Flow
Screenshot of Net Premium Flow (Cash flow)Enlarge×
What it shows
The premium cash flow (time value only) of aggressive option orders, cumulated from the start of each session, over the last 5 sessions, in millions of USD ($M). Four thin lines are four groups of order legs, read on the left axis: LC (aggressive call buying, green), SC (aggressive call selling, orange), LP (aggressive put buying, red), SP (aggressive put selling, blue). The yellow Net Premium Flow line is the net of all four (computed per package; see How it is calculated), read on the outer yellow axis on the right. Price (cyan) is read on the inner right axis.
How to read it
The sign on this chart is the sign of cash flow, not the direction of a bet. Aggressive option buyers (LC, LP) pay premium, so they count positive; aggressive option sellers (SC, SP) collect premium, so they count negative. Buying puts therefore lifts the yellow line, and selling calls pushes it down. A yellow line above 0 means that since the session open aggressive option buyers have paid more premium than aggressive option sellers have collected; below 0 means the reverse. The yellow line does not tell whether flow leans toward higher or lower prices; for that, read it with Net Delta Volume Flow. To compare sizes directly, SC and SP are flipped up (their names say "flipped up"): all four lines rise over time, height is size, and the true sign is shown in the tooltip. The steepest line is the group with the largest premium flow over that stretch; compare LC with SC to see whether, on the call side, buyers are paying more or sellers are collecting more, and LP with SP for the put side.
How it is calculated
Each option leg is placed in a group by its type (call or put) and the aggressive side of that leg. In multi-leg orders, a leg sold inside the package counts on the opposite side of the order: an aggressively bought bull call spread adds a part to LC (the bought leg) and a part to SC (the sold leg). Only the time value of premium is counted (premium minus intrinsic value). Intrinsic value is left out so that trades in deep in-the-money options, which behave almost like futures positions, do not swamp the option cash flow. Cumulated from 17:00 CT and reset to 0 at the start of each session; sessions are not joined. The yellow line is computed per package and the four groups per leg, so the sum of the four groups can differ slightly from the yellow line. Some special package types are not counted.
Watch out for
The yellow line has its own scale, and its pale yellow zero line does not line up with zero on the left axis: compare the yellow line with the four groups by direction (rising, falling, crossing 0), not by height. The yellow line is usually only a small fraction of each group, because most of the premium paid and collected on the two sides offsets. The aggressor side does not tell opening from closing: LC is aggressive call buying, which can be a holder of a short call buying back to close, not necessarily a new long call. The time axis folds away 15:30–19:00 CT (shared by the whole tab), so each session on the chart starts around 19:00 CT; trades from 17:00 CT are still in the cumulative total, so a line may not start exactly at 0. When a red "FALLBACK SOURCE" label shows next to the title, trade data is temporarily incomplete and the numbers cannot be compared with normal readings. The chart only describes order flow; it is not a signal and not investment advice.
08

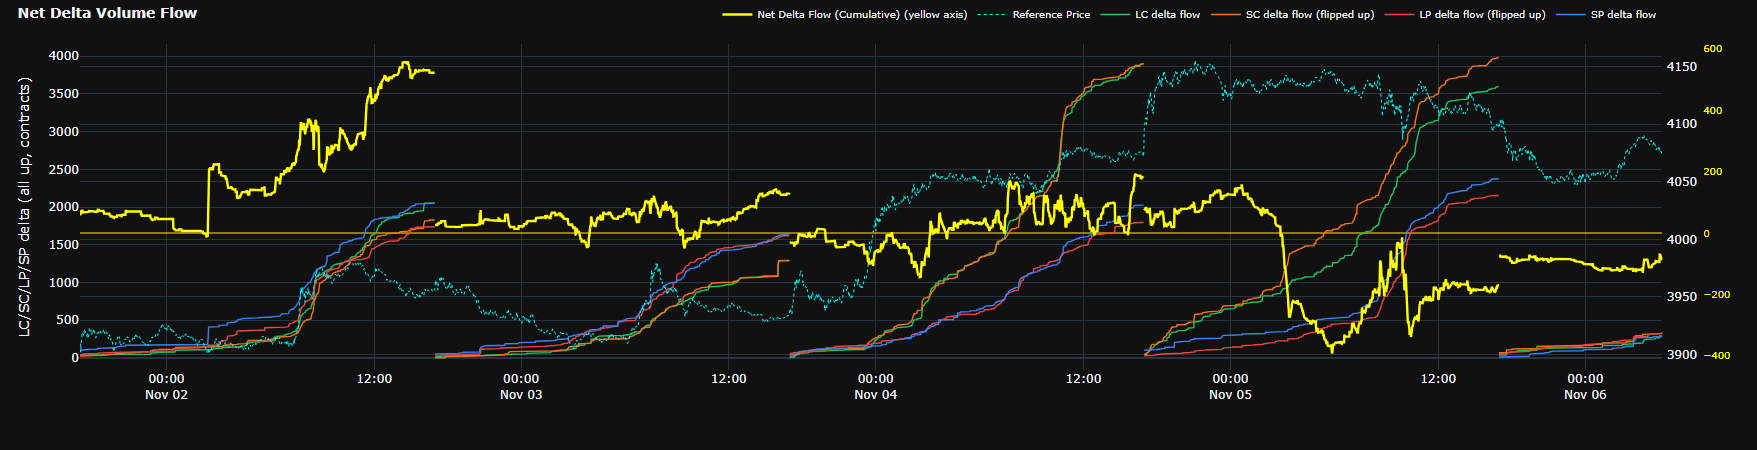
Net Delta Volume Flow

08 · Net Delta Volume FlowVolatility & Flow
Screenshot of Net Delta Volume FlowEnlarge×
What it shows
The delta of aggressive option orders, cumulated from the start of each session, over the last 5 sessions, in delta-equivalent futures contracts. Four thin lines LC, SC, LP, SP (same colours and meaning as on Net Premium Flow) are read on the left axis. The yellow Net Delta Flow (Cumulative) line is the net total, including the futures hedge leg, read on the outer yellow axis on the right. Reference Price (cyan, dotted) is read on the inner right axis.
How to read it
Each option leg adds its delta × lots, positive when the aggressor buys and negative when it sells. Calls have positive delta and puts negative delta, so LC and SP add positive delta while SC and LP add negative delta. A rising yellow line means aggressive option flow is taking on positive delta (leaning to buying calls, selling puts); falling means it is taking on negative delta (leaning to buying puts, selling calls). Example: the yellow line at +500 means that since the open, aggressive option orders have taken on delta equivalent to 500 futures contracts on the buy side. SC and LP are flipped up (their names say "flipped up") so all four lines rise: height is size, and the true sign is shown in the tooltip. Read it with Net Premium Flow, keeping in mind the two charts sign differently: on Net Premium, buying is positive for calls and puts alike; on Net Delta, calls and puts have opposite signs. A burst of aggressive put buying lifts Net Premium but pushes Net Delta down.
How it is calculated
Each option leg is grouped as on Net Premium Flow: by its type and the aggressive side of that leg, with a leg sold inside a package counted on the opposite side of the order. The yellow line also includes the delta of the futures leg in option packages hedged with futures; that part belongs to no group, so the sum of the four groups can differ from the yellow line by a small amount. Some orders are grouped or filtered to reduce noise. Cumulated from 17:00 CT and reset to 0 at the start of each session; sessions are not joined.
Watch out for
This is the FLOW of delta traded, not a position: the aggressor side does not tell opening from closing, so buying calls to close an earlier short also adds positively. Units are delta-equivalent contracts, not dollars. The yellow line has its own scale, and its pale yellow zero line does not line up with zero on the left axis: compare by direction, not by height; the yellow line is usually only a small fraction of each group, because delta on the two sides offsets. The time axis folds away 15:30–19:00 CT like the rest of the tab; trades from 17:00 CT are still counted, so a line may not start exactly at 0. When a red "FALLBACK SOURCE" label shows next to the title, the numbers cannot be compared with normal readings. The chart only describes order flow; it is not a signal and not investment advice.

09

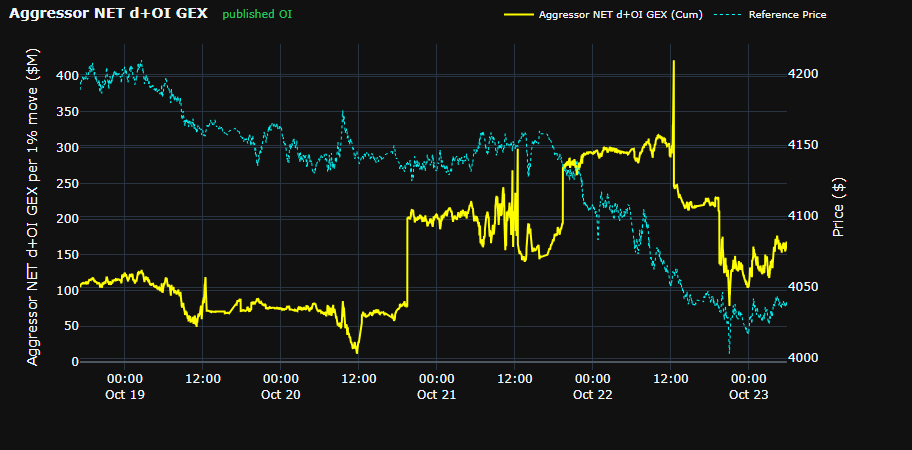
Aggressor NET d+OI GEX (Cumulative)

09 · Aggressor NET d+OI GEX (Cumulative)Volatility & Flow
Screenshot of Aggressor NET d+OI GEX (Cumulative)Enlarge×
What it shows
Gamma exposure of the AGGRESSOR side from published OI positions, times live gamma and price.
How to read it
Positive = aggressors are long gamma (the passive side is short gamma). The line steps at each CME OI publication; between steps it drifts only with gamma and price. It does not reset at 17:00.
How it is calculated
The same Long − Short position GEX as the Passive GEX Profile, but with the AGGRESSOR side's sign, summed over all contracts, with gamma and price updating continuously.
Watch out for
Opposite sign to the Passive GEX Profile. The chart can be empty when pricing data is incomplete.
10

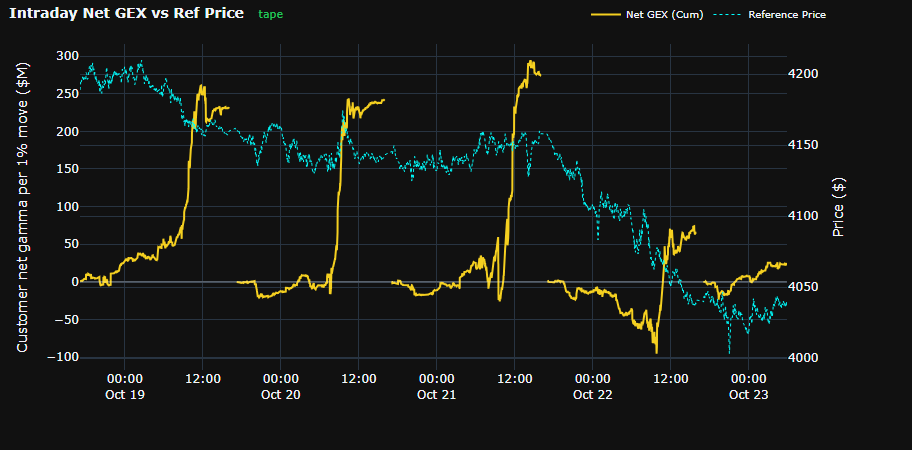
Intraday Net GEX vs Ref Price

10 · Intraday Net GEX vs Ref PriceVolatility & Flow
Screenshot of Intraday Net GEX vs Ref PriceEnlarge×
What it shows
Gamma that customers bought or sold aggressively TODAY, cumulated per session.
How to read it
Positive = aggressors bought more gamma than they sold today (the passive side took the short side); negative = aggressors sold gamma. Compared with the previous chart: that one is the accumulated position from OI, this one is today's flow.
How it is calculated
Each option trade today: Γ × 100 × F² × 1% × size, positive when the aggressor buys the option and negative when it sells (calls and puts alike). Cumulated through the session.
Watch out for
When trade data is temporarily incomplete, the chart shows "Waiting for intraday GEX data…" instead of a backup figure. Resets at 17:00 CT.

11

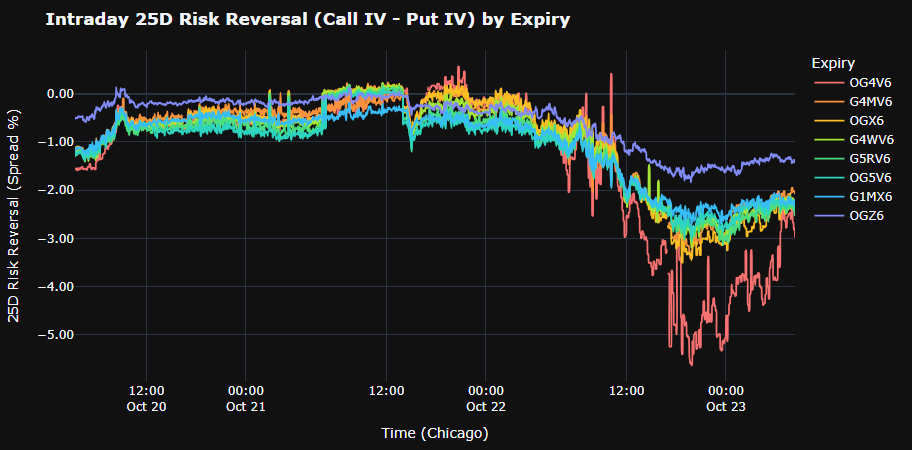
Intraday 25D Risk Reversal by Expiry

11 · Intraday 25D Risk Reversal by ExpiryVolatility & Flow
Screenshot of Intraday 25D Risk Reversal by ExpiryEnlarge×
What it shows
25-delta RR over 3 days, one line per expiry (the 7 nearest including 0DTE + the nearest monthly with ≥ 7 days).
How to read it
Positive RR = 25Δ calls cost more than 25Δ puts (the market pays up for upside); negative = puts cost more (downside protection). RR falling fast while price drops = rising demand for downside insurance.
How it is calculated
RR = 25Δ call IV − 25Δ put IV, read from each expiry's smile. 0DTE uses a separate method suited to very short remaining time. Units: vol points.
Watch out for
Points between 15:30 and 19:00 CT are removed and the line joins straight across. The spline can overshoot the real points. 0DTE near expiry is very noisy.

12

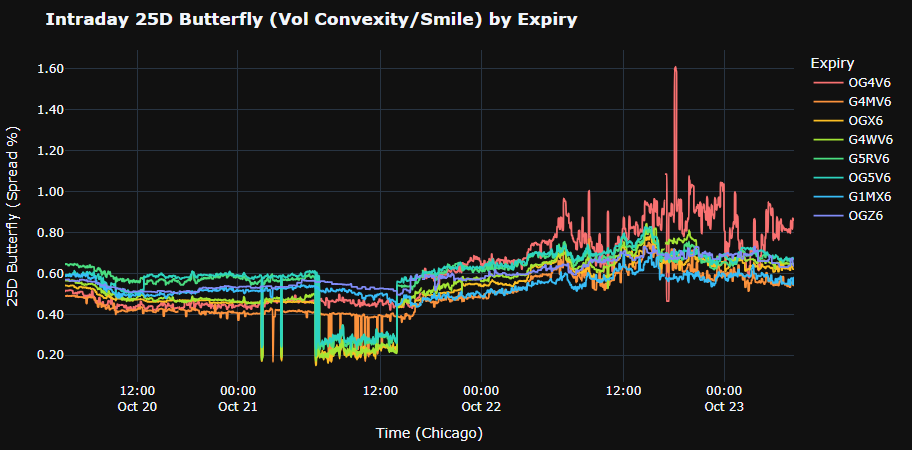
Intraday 25D Butterfly by Expiry

12 · Intraday 25D Butterfly by ExpiryVolatility & Flow
Screenshot of Intraday 25D Butterfly by ExpiryEnlarge×
What it shows
25-delta BF (smile convexity) over 3 days by expiry.
How to read it
Rising BF = the wings (far calls and puts) get more expensive versus ATM — the market pays more for large moves either way. BF up with RR down = demand for put-wing insurance.
How it is calculated
BF = (25Δ call IV + 25Δ put IV)/2 − ATM IV, same source as RR.
Watch out for
As for RR: 15:30–19:00 CT removed, 0DTE noisy.

13

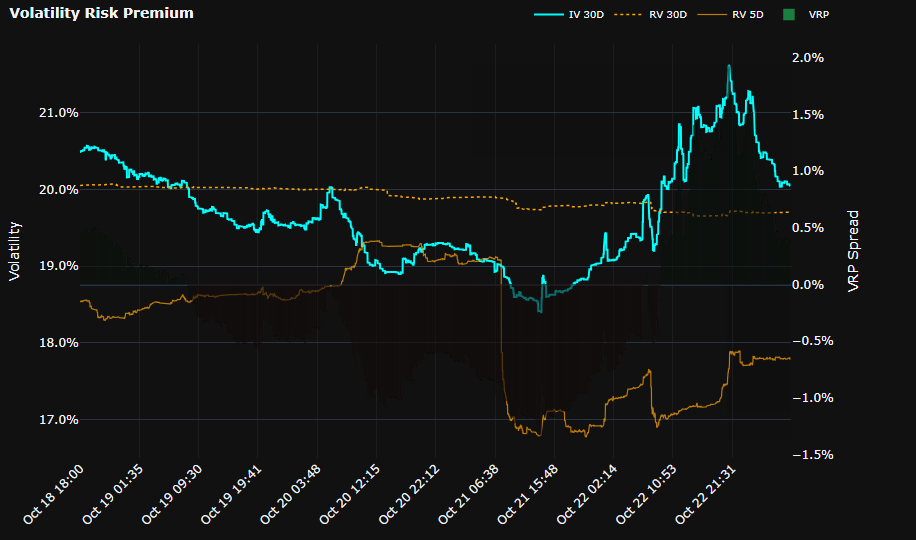
Volatility Risk Premium

13 · Volatility Risk PremiumVolatility & Flow
Screenshot of Volatility Risk PremiumEnlarge×
What it shows
30-day ATM IV (cyan), 30-day RV (orange dotted), 5-day RV (amber) and VRP = IV − RV bars (secondary axis).
How to read it
Positive VRP = implied above realized — option sellers are being paid an insurance premium; negative VRP = the market is moving more than options price. RV 5D rising above IV 30D is an early warning that volatility is picking up.
How it is calculated
IV 30D is ATM implied volatility at a constant 30-day maturity, interpolated from LevelQuants' volatility surface. RV is annualised realized volatility from intraday GC futures returns, over about 30 sessions (RV 30D) and 5 sessions (RV 5D). VRP = IV 30D − RV 30D.
Watch out for
The x axis is CATEGORICAL (one time label per point), so time spacing is not proportional; market breaks are removed. VRP bars use their own axis; do not compare bar height with the IV lines.

14

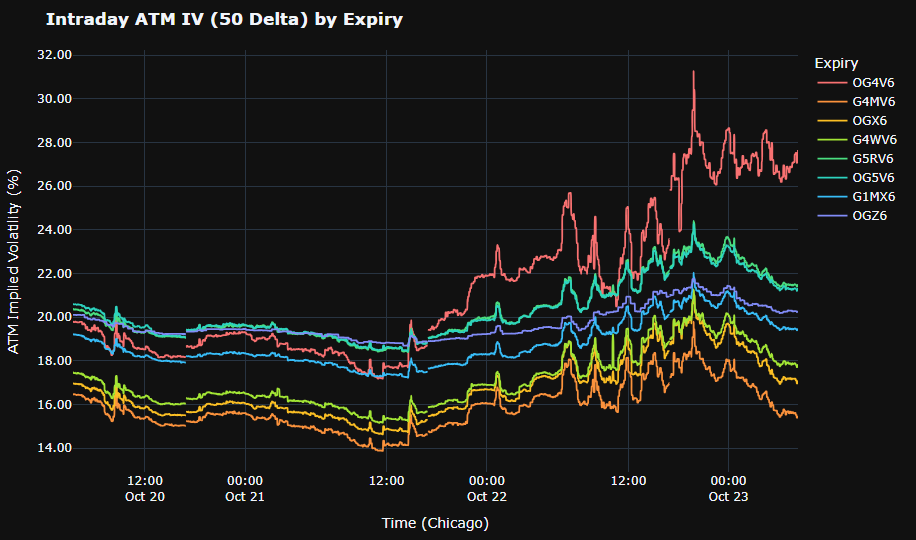
Intraday ATM IV (50 Delta) by Expiry

14 · Intraday ATM IV (50 Delta) by ExpiryVolatility & Flow
Screenshot of Intraday ATM IV (50 Delta) by ExpiryEnlarge×
What it shows
ATM IV over 3 days for each expiry.
How to read it
The ordering of the lines shows the instant term structure: near expiries above far ones = backwardation (short-term stress). Near expiries jumping around economic events and falling back after them is normal.
How it is calculated
ATM IV = average of call and put IV at 50 delta, read for each expiry.
Watch out for
15:30–19:00 CT removed; 0DTE dropping sharply late on expiry day is a time effect, not a signal.

15

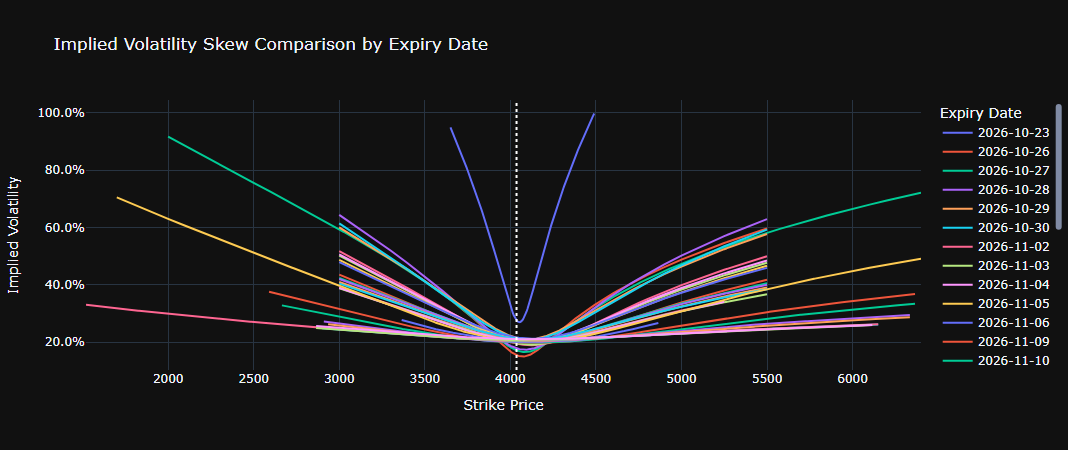
Implied Volatility Skew Comparison by Expiry Date

15 · Implied Volatility Skew Comparison by Expiry DateVolatility & Flow
Screenshot of Implied Volatility Skew Comparison by Expiry DateEnlarge×
What it shows
Snapshot of the IV smile by strike for every expiry (including 0DTE); the white dotted line is the Reference Price.
How to read it
Compare slopes across expiries: steeper near expiries = tight short-term skew. Smiles curling up at both ends = expensive wings.
How it is calculated
IV by strike for each expiry at snapshot time, with strikes aligned to the reference price. Abnormal IV points in the far wings are filtered out.
Watch out for
A SNAPSHOT with no history. Wings can be cut short by the cleaning step.

16

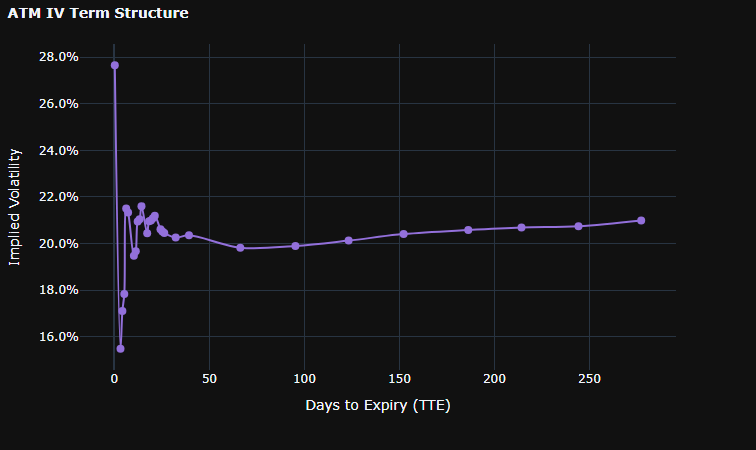
ATM IV Term Structure

16 · ATM IV Term StructureVolatility & Flow
Screenshot of ATM IV Term StructureEnlarge×
What it shows
ATM IV by days to expiry (snapshot).
How to read it
Upward sloping (contango) is normal; downward at the short end = stress or a nearby event. A bump in the middle usually marks the expiry that contains an event.
How it is calculated
Per expiry: average of call and put IV at 50 delta, ordered by days to expiry.
Watch out for
The spline is only visual smoothing; read the values at the dots.

17

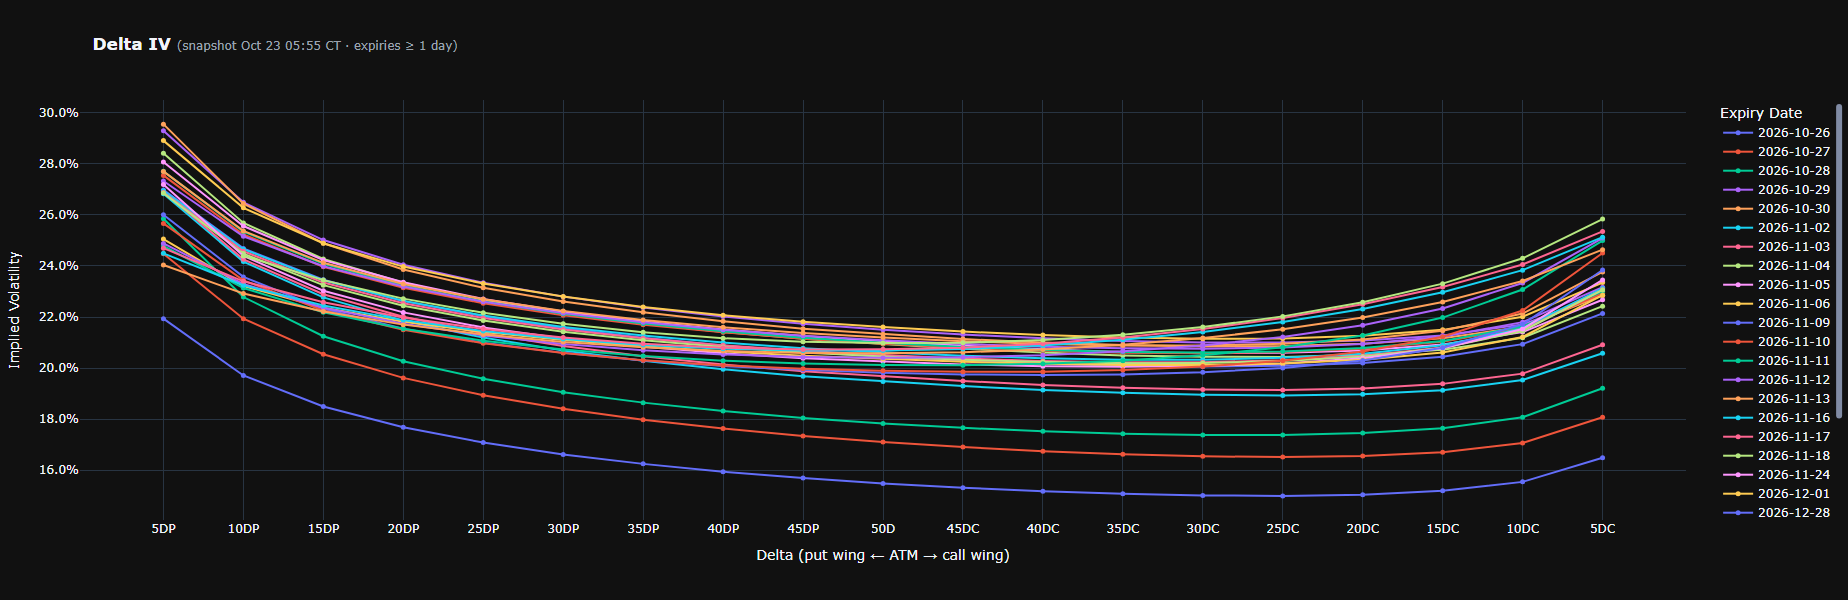
Delta IV

17 · Delta IVVolatility & Flow
Screenshot of Delta IVEnlarge×
What it shows
Smiles by DELTA for every expiry ≥ 1 day: x axis 5DP … 50D … 5DC.
How to read it
A delta axis puts expiries on the same probability scale (unlike strikes). Put side higher than call side = put skew; a minimum shifted towards calls = the market prices upside risk.
How it is calculated
Each side (put, call) reads IV at deltas 5…45; 50D is the average of both sides. No extrapolation beyond the available range.
Watch out for
No 0DTE. The title shows the snapshot time.

18

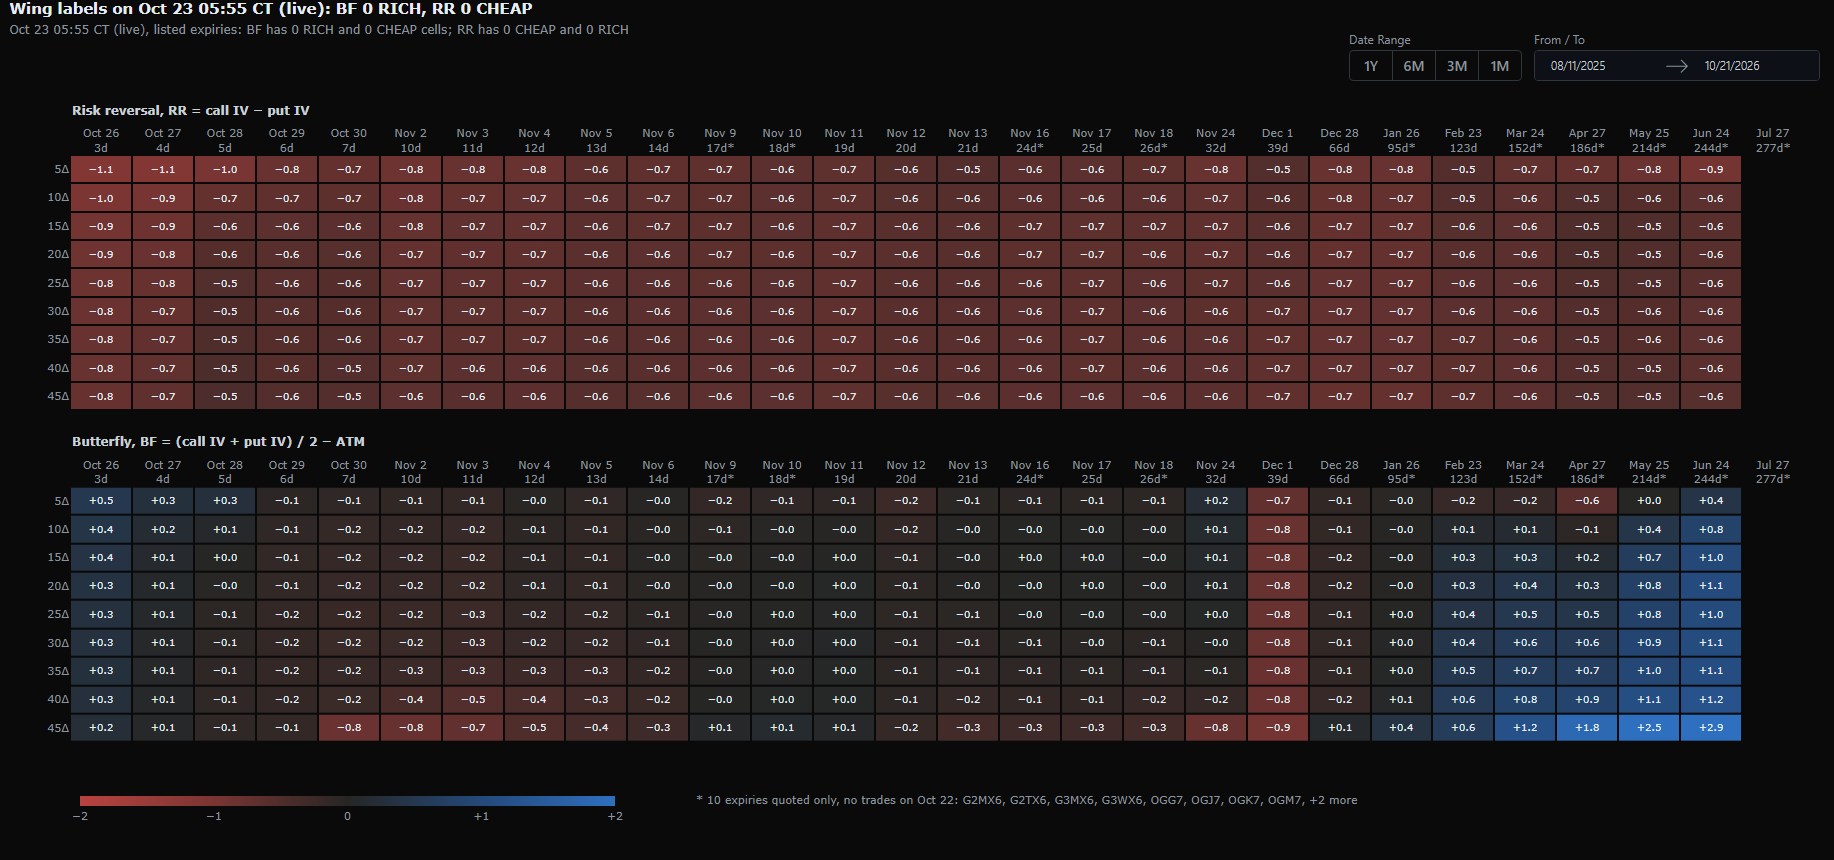
Wing z-score map

18 · Wing z-score mapVolatility & Flow
Screenshot of Wing z-score mapEnlarge×
What it shows
Two heatmaps of the smile's SHAPE: RR = call IV − put IV (skew) and BF = (call IV + put IV)/2 − ATM IV (convexity); rows are deltas 5Δ…45Δ, columns are the listed expiries. Each cell is the z-score of today's RR or BF value against that cell's own history.
How to read it
Blue = the RR/BF value is above its history, red = below (±2 scale). OUTLINED cells carry a label when the deviation is extreme: For RR (the smile's skew): RICH = RR unusually high — calls are priced above puts by MORE than usual, i.e. the skew leans towards calls or the put side is unusually flat; CHEAP = RR unusually low — puts are priced above calls by more than usual, i.e. the put skew is unusually steep (rising demand for downside protection). For BF (the smile's convexity): RICH = BF unusually high — both wings (call and put at that delta) are expensive relative to ATM by more than usual, an unusually convex smile; CHEAP = BF unusually low — both wings are cheap relative to ATM, an unusually flat smile. These labels describe RELATIVE pricing between points on the smile, not the absolute IV level (ATM can stay put or move the other way), and they are not trading recommendations. The 1Y/6M/3M/1M buttons and From/To pick the history window.
How it is calculated
Compares today's RR and BF at each delta and expiry with the history of earlier settlement sessions: z tells how many standard deviations away it is, the percentile tells where it ranks in history. Labels are only applied when the history is long enough to be statistically meaningful.
Watch out for
A RICH cell on RR does not mean calls there are "expensive" in absolute terms — only that the call − put spread is wider than usual; likewise BF RICH means the wings are expensive RELATIVE TO ATM. Check the ATM level on Volatility Cones before drawing conclusions about absolute pricing. "*" = quoted only, no trades in the session; beyond 270 days is n/a; changing the history window changes z.

19

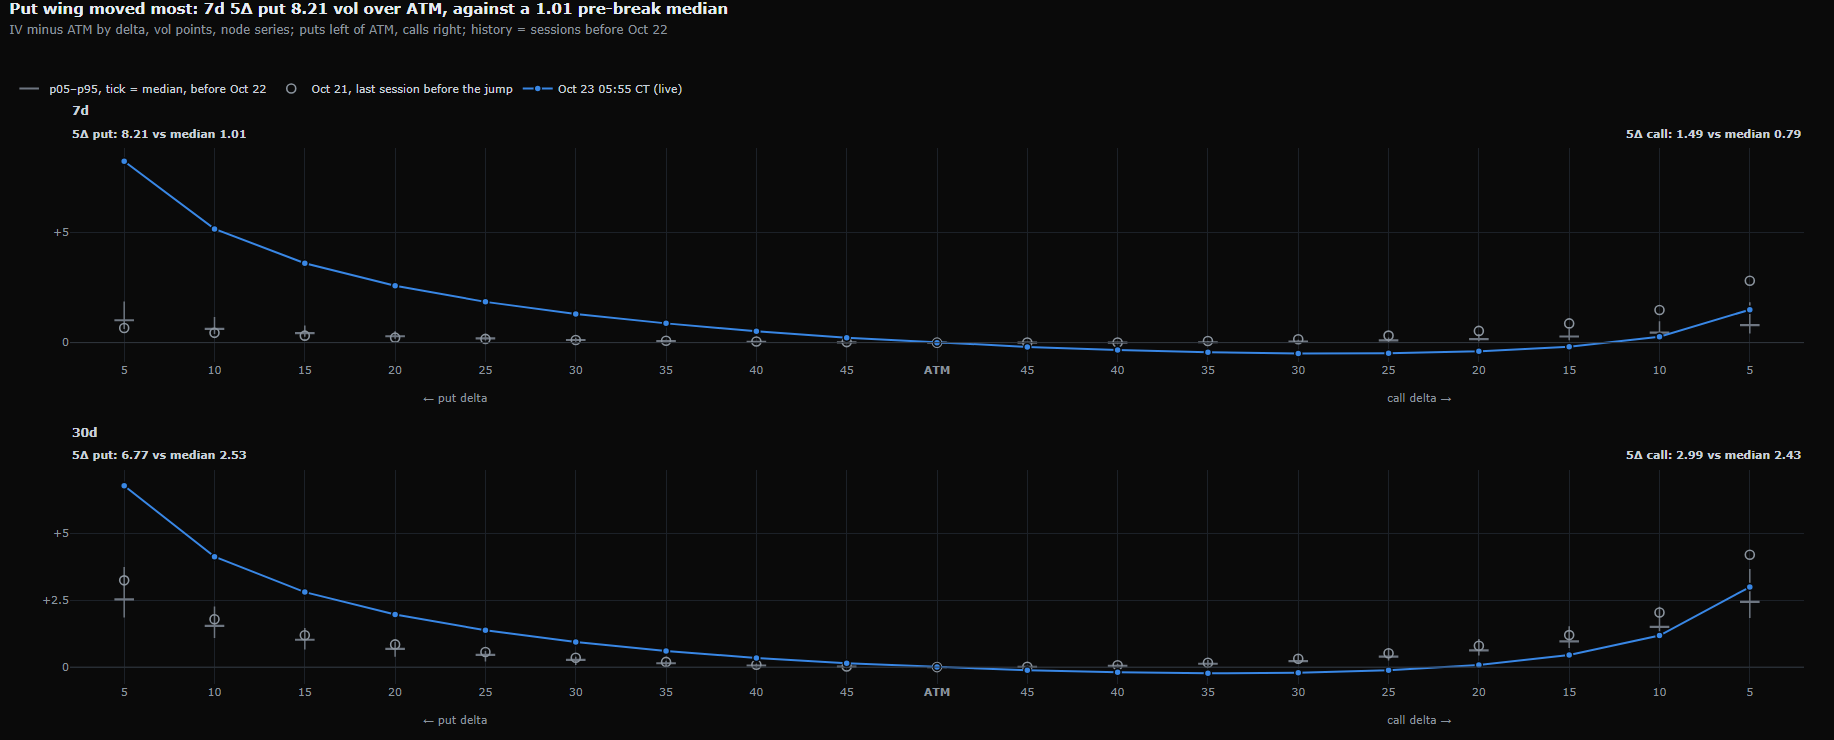
Smile vs history

19 · Smile vs historyVolatility & Flow
Screenshot of Smile vs historyEnlarge×
What it shows
Today's smile (blue line) versus its historical distribution at 7-day and 30-day maturities: grey tick = median, whiskers p05–p95, hollow circle = previous session.
How to read it
A blue point outside the whiskers = that wing is unusual versus history. The title names the 5Δ wing furthest from its median (at capture: 7-day 5Δ put 8.21 vol over ATM against a 1.01 median).
How it is calculated
y = IV at each delta minus ATM IV (vol points), against its historical distribution at the same maturity. When a recent session shows an abrupt jump, history is cut before it so two regimes are not mixed.
Watch out for
The subtitle says where history stops; read it before drawing conclusions.

Tab · Volatility Cones

Places current ATM IV, Risk Reversal and Butterfly inside their historical distribution at each maturity, to see whether they are rich or cheap.

20

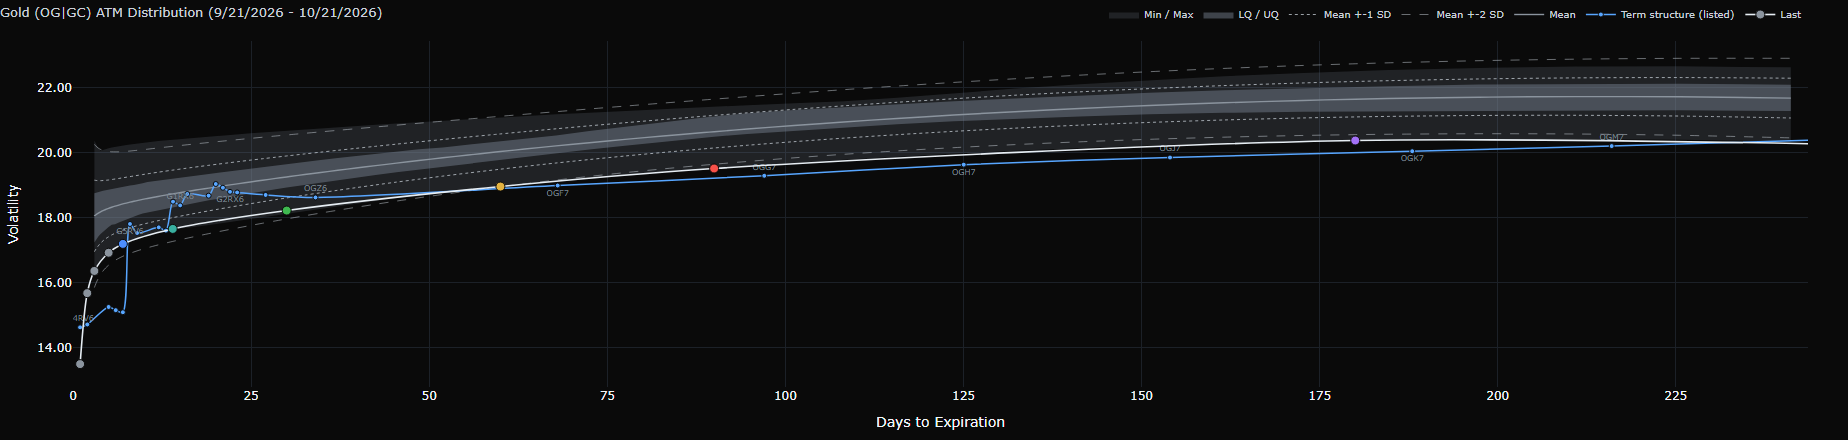
Gold (OG|GC) ATM Distribution

20 · Gold (OG|GC) ATM DistributionVolatility Cones
Screenshot of Gold (OG|GC) ATM DistributionEnlarge×
What it shows
Historical distribution cone of ATM IV by maturity. The x axis is days to expiry at constant maturity. Grey bands from light to dark: Min/Max → 5/95 → LQ/UQ (25–75%); the grey line is the Mean; dotted/dashed lines are Mean ± 1/2 SD. The white "Last" line is the latest session; the blue "Term structure (listed)" line shows the actual listed contracts with their codes.
How to read it
The Last line near the top of the cone = vol is rich versus history at that maturity; near the bottom = cheap. Hover a Last point to see Percentile, z and the RICH/CHEAP label. Compare Last with the listed line to see where real contracts diverge from the constant-maturity line.
How it is calculated
ATM = average of call and put IV at 50 delta. History is a midday snapshot of each session (at capture: 307 sessions since Aug 11, 2025), interpolated to constant maturities. At each anchor maturity, the percentile and z compare the latest value with history inside the Date Range window; RICH when it is both in the top 10% and more than 2 standard deviations above the mean, CHEAP when the reverse.
Watch out for
"Last" is NOT live: it is the latest session in history, usually yesterday or earlier (on Oct 23 at capture, the last session was Oct 21). Date Range is the HISTORY SAMPLE used for the cone, percentiles and z — not a zoom; short windows can hide the LQ/UQ and 5/95 bands for lack of sessions. Your Delta / Date Range / From-To choice is remembered by the browser across reloads.

21

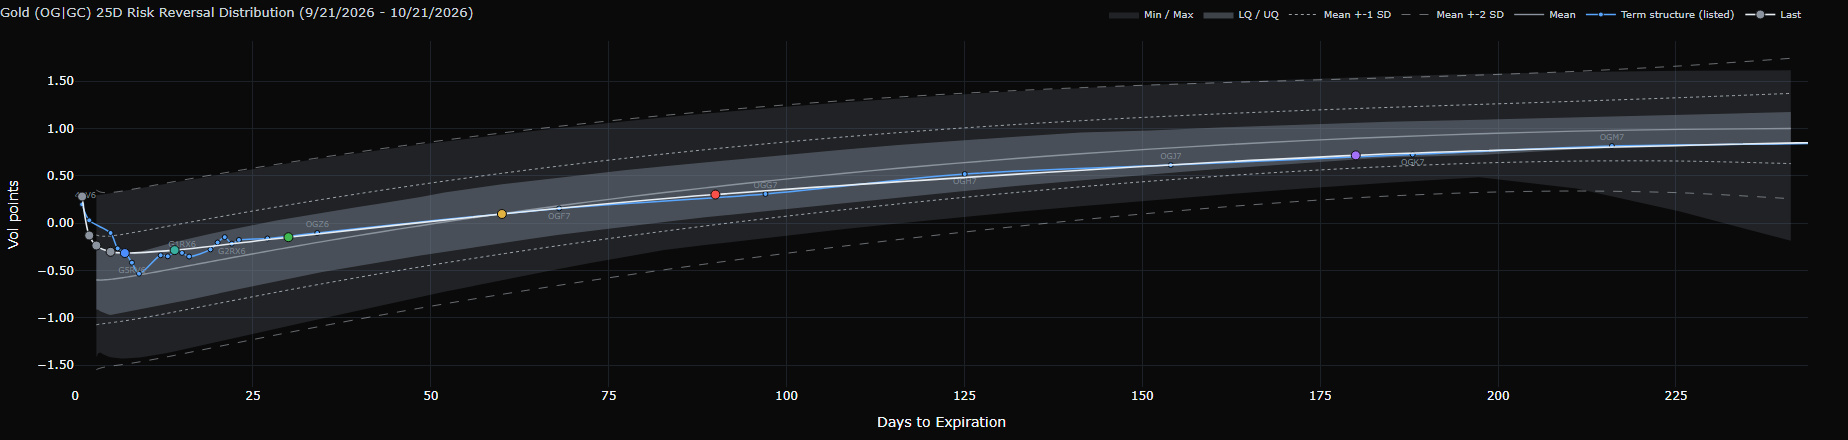
Gold (OG|GC) Risk Reversal Distribution

21 · Gold (OG|GC) Risk Reversal DistributionVolatility Cones
Screenshot of Gold (OG|GC) Risk Reversal DistributionEnlarge×
What it shows
RR cone at the selected delta (25Δ by default). The x axis is days to expiry at constant maturity. Grey bands from light to dark: Min/Max → 5/95 → LQ/UQ (25–75%); the grey line is the Mean; dotted/dashed lines are Mean ± 1/2 SD. The white "Last" line is the latest session; the blue "Term structure (listed)" line shows the actual listed contracts with their codes.
How to read it
RR is the smile's skew. Last ABOVE the cone (RICH) = RR unusually high: calls are priced above puts by more than usual at that maturity. Last BELOW the cone (CHEAP) = RR unusually low: puts are priced above calls by more than usual — an unusually steep put skew, strong demand for downside protection. This is a relative comparison between calls and puts, not the absolute IV level. The 5Δ–45Δ buttons change the delta for RR and BF.
How it is calculated
RR(kΔ) = call IV at kΔ − put IV at kΔ. History is a midday snapshot of each session (at capture: 307 sessions since Aug 11, 2025), interpolated to constant maturities. At each anchor maturity, the percentile and z compare the latest value with history inside the Date Range window; RICH when it is both in the top 10% and more than 2 standard deviations above the mean, CHEAP when the reverse.
Watch out for
"Last" is NOT live: it is the latest session in history, usually yesterday or earlier (on Oct 23 at capture, the last session was Oct 21). Date Range is the HISTORY SAMPLE used for the cone, percentiles and z — not a zoom; short windows can hide the LQ/UQ and 5/95 bands for lack of sessions. Your Delta / Date Range / From-To choice is remembered by the browser across reloads.

22

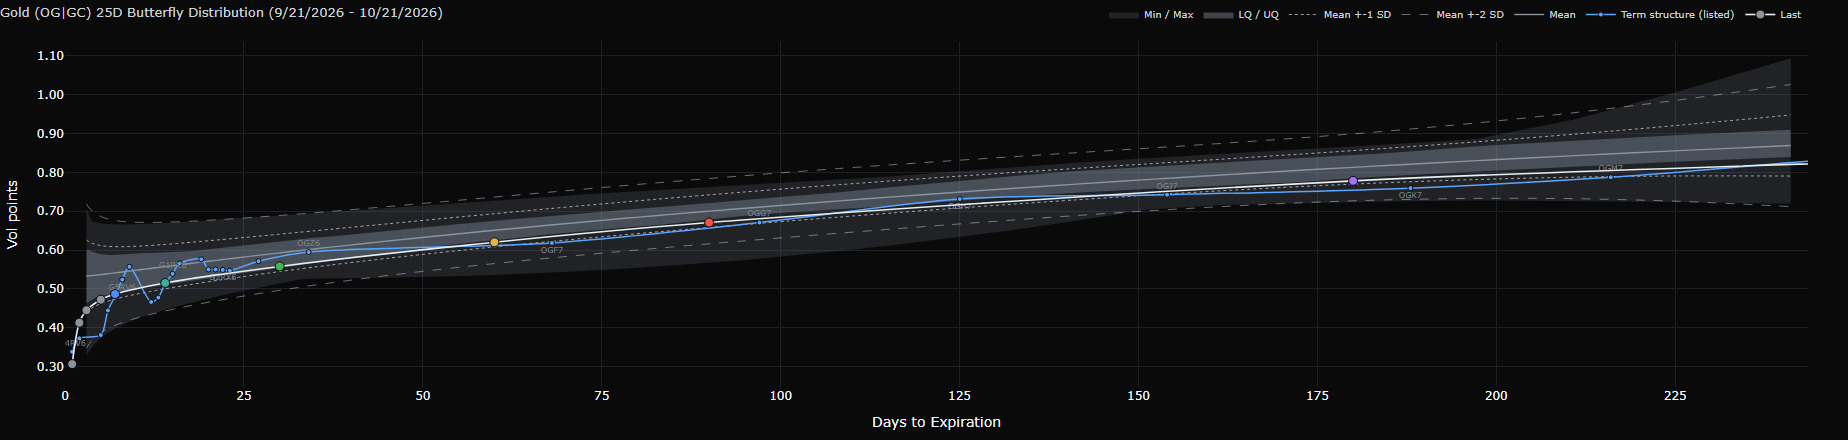
Gold (OG|GC) Butterfly Distribution

22 · Gold (OG|GC) Butterfly DistributionVolatility Cones
Screenshot of Gold (OG|GC) Butterfly DistributionEnlarge×
What it shows
BF cone at the selected delta. The x axis is days to expiry at constant maturity. Grey bands from light to dark: Min/Max → 5/95 → LQ/UQ (25–75%); the grey line is the Mean; dotted/dashed lines are Mean ± 1/2 SD. The white "Last" line is the latest session; the blue "Term structure (listed)" line shows the actual listed contracts with their codes.
How to read it
BF is the smile's convexity. Last ABOVE the cone (RICH) = BF unusually high: both wings are expensive relative to ATM by more than usual, the market pays up for large moves either way. Last BELOW the cone (CHEAP) = BF unusually low: both wings are cheap relative to ATM, an unusually flat smile. This is wing pricing RELATIVE TO ATM, not the absolute IV level.
How it is calculated
BF(kΔ) = (call IV at kΔ + put IV at kΔ)/2 − ATM. History is a midday snapshot of each session (at capture: 307 sessions since Aug 11, 2025), interpolated to constant maturities. At each anchor maturity, the percentile and z compare the latest value with history inside the Date Range window; RICH when it is both in the top 10% and more than 2 standard deviations above the mean, CHEAP when the reverse.
Watch out for
"Last" is NOT live: it is the latest session in history, usually yesterday or earlier (on Oct 23 at capture, the last session was Oct 21). Date Range is the HISTORY SAMPLE used for the cone, percentiles and z — not a zoom; short windows can hide the LQ/UQ and 5/95 bands for lack of sessions. Your Delta / Date Range / From-To choice is remembered by the browser across reloads.

Tab · Advanced Analytics

The Quantum chart and position-weighted second-order Greeks: Vanna, Charm, Zomma, Color, and their split by expiry bucket. Use it to understand hedging flows when price, volatility and time change.

23

Quantum

23 · QuantumAdvanced Analytics
Screenshot of QuantumEnlarge×
What it shows
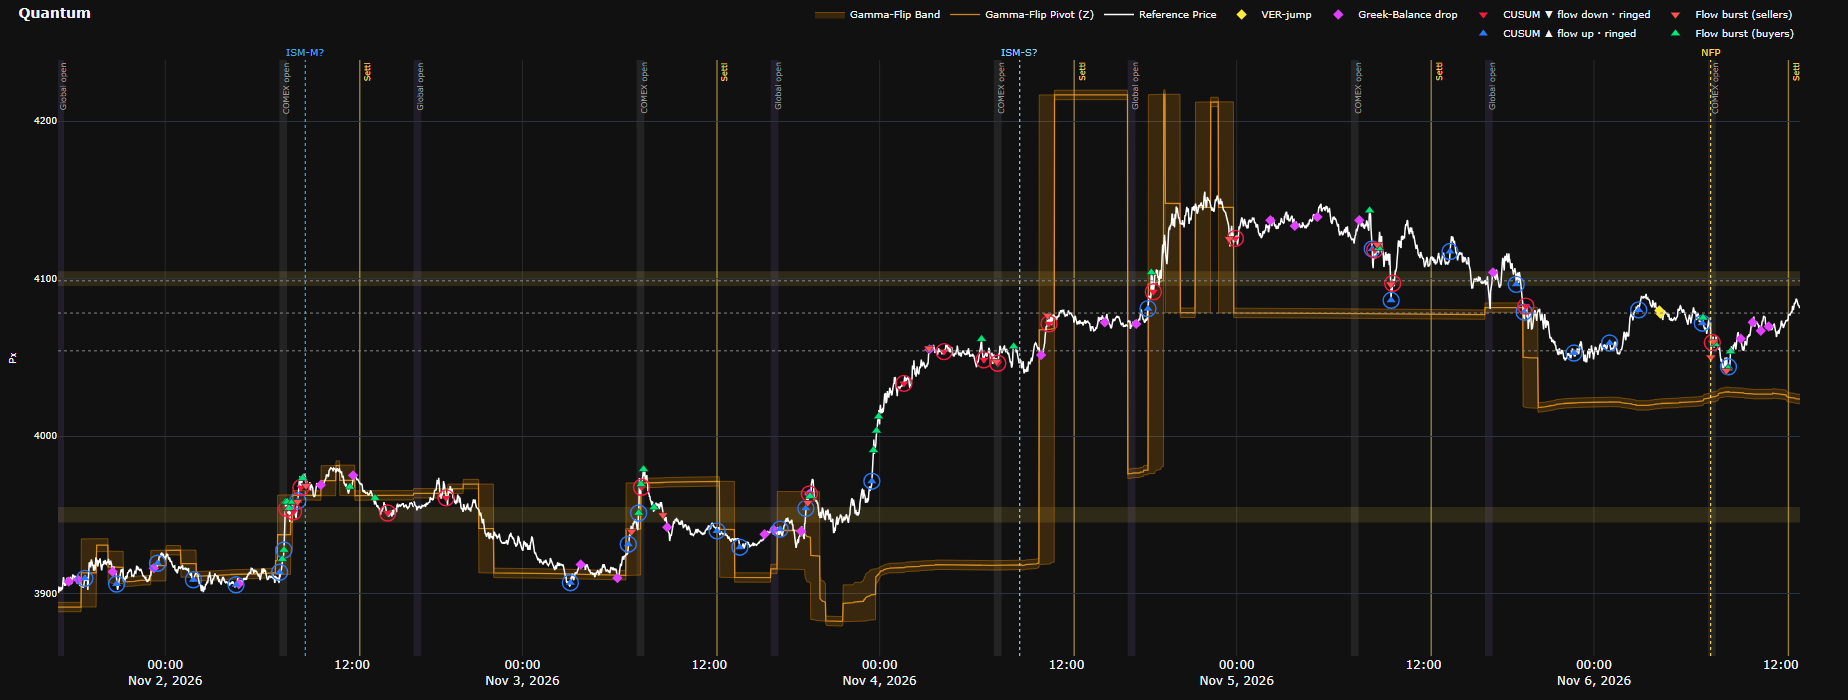
Five days of price with the Gamma-Flip band (orange) and the Gamma-Flip Pivot (Z) line running through its middle, OI wall zones (faint gold bands), shelves (grey dotted horizontals) and markers describing flow rhythm. An economic-calendar slider sits below.
How to read it
The Gamma-Flip band marks the nearest price at which the passive side's GEX profile changes sign: positive on one side, negative on the other. It does not say which side is long and which is short, because the sign change can run from negative to positive or from positive to negative: with price above the band, the passive side is long gamma at price in some sessions and short gamma in others. Read the state at price on Passive GEX Profile with Risk Zones: is price inside a green zone, a red zone or an unshaded stretch? On Quantum, follow the band over time: the distance from price to the band shows roughly how far away the nearest sign change of this profile is; price crossing the band, or the band stepping to a new level (for example after a CME OI publication, or when price nears another sign change), is the moment to check Passive GEX Profile again. OI walls are the strikes with the largest |GEX|. Shelves are the prices where price spent the most time in the last 24 hours. Ringed ▲/▼ (CUSUM) = futures volume pace rising/falling, NOT buying/selling. Gold diamond = VER-jump, magenta = Greek-Balance drop, green/red triangles = flow bursts on the buy/sell side. Vertical bands: Global open 17:00, COMEX open 07:20, Settl line 12:30 CT. Drag the slider to see upcoming economic events (solid line + ▲ = within 48 hours).
How it is calculated
Z (the Gamma-Flip Pivot level) comes from the passive side's GEX profile based on estimated positions — the same kind of profile as Passive GEX Profile — except that expiries are weighted differently, 0DTE is excluded and the profile is smoothed. Z is the nearest clear sign change to price, in either direction; it is held steady so that it does not flicker between two nearby sign changes, and it is recomputed regularly through the session. The band is Z's range over roughly the hour around each point; the Gamma-Flip Pivot (Z) line is the band's midpoint, and "Pivot" is only a name, not a pivot point in the technical-analysis sense. Z is not a "zero gamma" level found by recomputing total gamma at hypothetical prices; it is where the per-strike profile at the current price changes sign. OI walls are the strikes with the largest GEX. Shelves are the prices where price spent the most time in the last 24 hours. Markers on the price line flag unusual changes in the pace and side of futures order flow.
Watch out for
Markers only DESCRIBE flow rhythm; they do not forecast direction. The Gamma-Flip band is not support or resistance and not an entry signal. The band is redrawn as new data arrives: the part near the right edge can still shift for about half an hour, and the past is drawn with data that came in later, so looking back, price touching the band and turning looks cleaner than it did live. When the band widens sharply (Z jumped within that stretch), the middle line is only a midpoint, not a sign change. Z and Passive GEX Profile treat expiries differently, so Z's sign change need not coincide with where the green and red zones meet; when they disagree, take the state at price from Passive GEX Profile.

24

Vanna & Charm Risk Profile vs. Price

24 · Vanna & Charm Risk Profile vs. PriceAdvanced Analytics
Screenshot of Vanna & Charm Risk Profile vs. PriceEnlarge×
What it shows
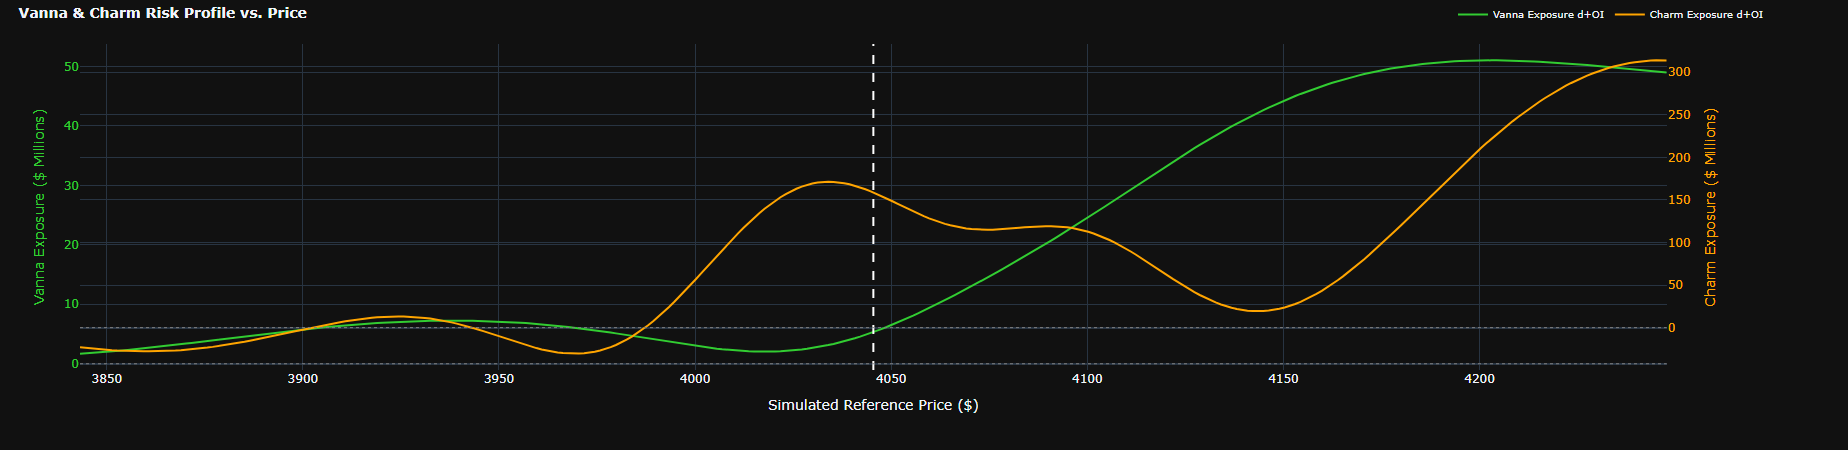
Passive-side Vanna exposure (green, left axis, $M per vol point) and Charm exposure (orange, right axis, $M per day), simulated for prices from −5% to +5%.
How to read it
Vanna tells how much the passive side's delta to hedge changes when IV rises 1 point; Charm tells how much it changes per day that passes. Large values around the current price = significant hedging flow when IV or time changes (especially near expiry).
How it is calculated
For each hypothetical price within ±5%, Vanna and Charm are recomputed for every option (IV held fixed) and multiplied by the Long − Short position, passive side's sign. Vanna: $M per vol point; Charm: $M per day.
Watch out for
Assumes IV is fixed per strike (ignores the skew moving). The two axes are independent — do not compare vanna height with charm.

25

Intraday Net Vanna & Charm

25 · Intraday Net Vanna & CharmAdvanced Analytics
Screenshot of Intraday Net Vanna & CharmEnlarge×
What it shows
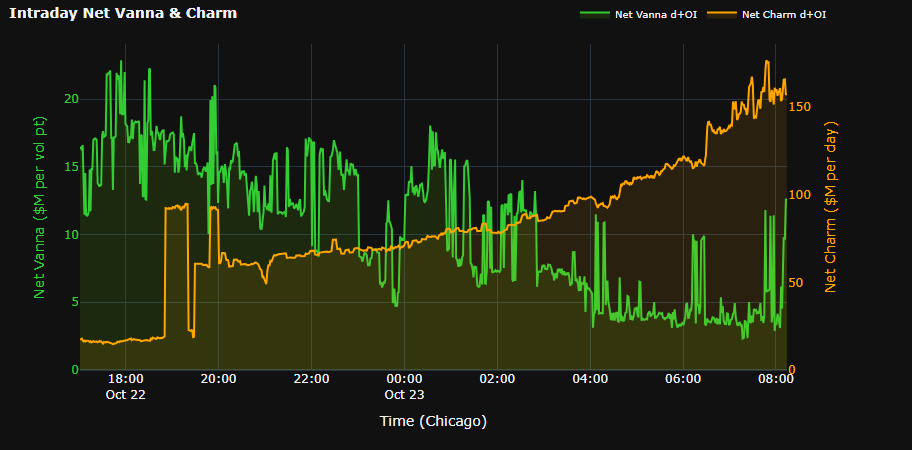
Passive-side Net Vanna and Net Charm minute by minute through the current global session.
How to read it
These are LEVELS, not changes since the session open. Sudden steps usually line up with CME OI publication times (positions changed). Large charm in the last hour before expiry comes from 0DTE.
How it is calculated
Every minute: total Vanna and Charm of all options times the Long − Short position, passive side's sign, including 0DTE.
Watch out for
The global session runs 17:00 → 17:00 CT.

26

Passive GEX Profile with Risk Zones (half width)

26 · Passive GEX Profile with Risk Zones (half width)Advanced Analytics
Screenshot of Passive GEX Profile with Risk Zones (half width)Enlarge×
What it shows
A half-width copy of the Passive GEX Profile from the Market Overview tab, placed next to Vanna & Charm so both can be read together.
How to read it
Read it like the Passive GEX Profile section above. The two top text boxes are merged into one "carried-in … · total …" line; the legend sits below the strike axis.
How it is calculated
Same calculation and same data as the Market Overview version.
Watch out for
No new information compared with the full-size version.

27

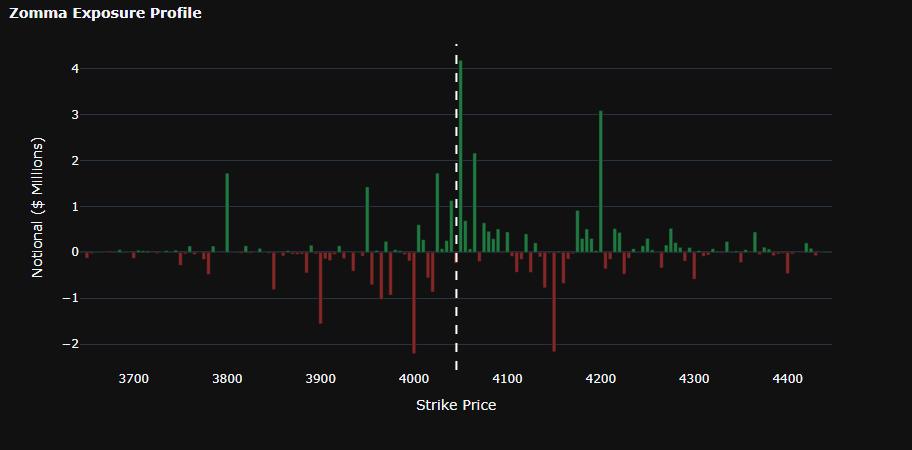
Zomma Exposure Profile

27 · Zomma Exposure ProfileAdvanced Analytics
Screenshot of Zomma Exposure ProfileEnlarge×
What it shows
Passive-side Zomma by strike: how much GEX changes when IV rises 1 vol point.
How to read it
Green bars = GEX at that strike rises when IV rises; red = falls. Use it to see which gamma zones are sensitive to a volatility jump or crush (e.g. before an event).
How it is calculated
Zomma (sensitivity of gamma to IV) × 100 × F² × 1% times the Long − Short position, summed by strike, passive side's sign. $M.
Watch out for
Third-order greeks are small and unstable in the deep wings; most meaningful near ATM.

28

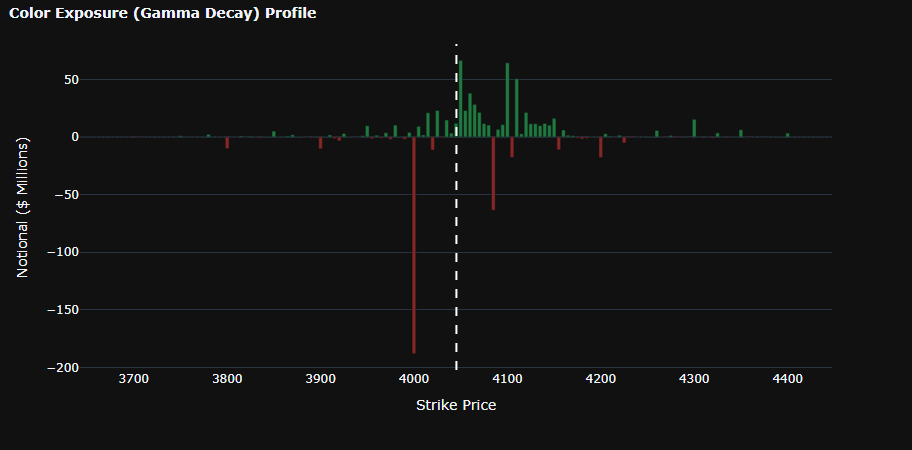
Color Exposure (Gamma Decay) Profile

28 · Color Exposure (Gamma Decay) ProfileAdvanced Analytics
Screenshot of Color Exposure (Gamma Decay) ProfileEnlarge×
What it shows
Passive-side Color by strike: how much GEX changes per calendar day that passes.
How to read it
Shows how the gamma profile will shift overnight or over a weekend even with price unchanged — important for strikes close to expiry.
How it is calculated
Color (decay of gamma over time) × 100 × F² × 1% times the Long − Short position, summed by strike, passive side's sign. $M.
Watch out for
As for Zomma: read around ATM.

29

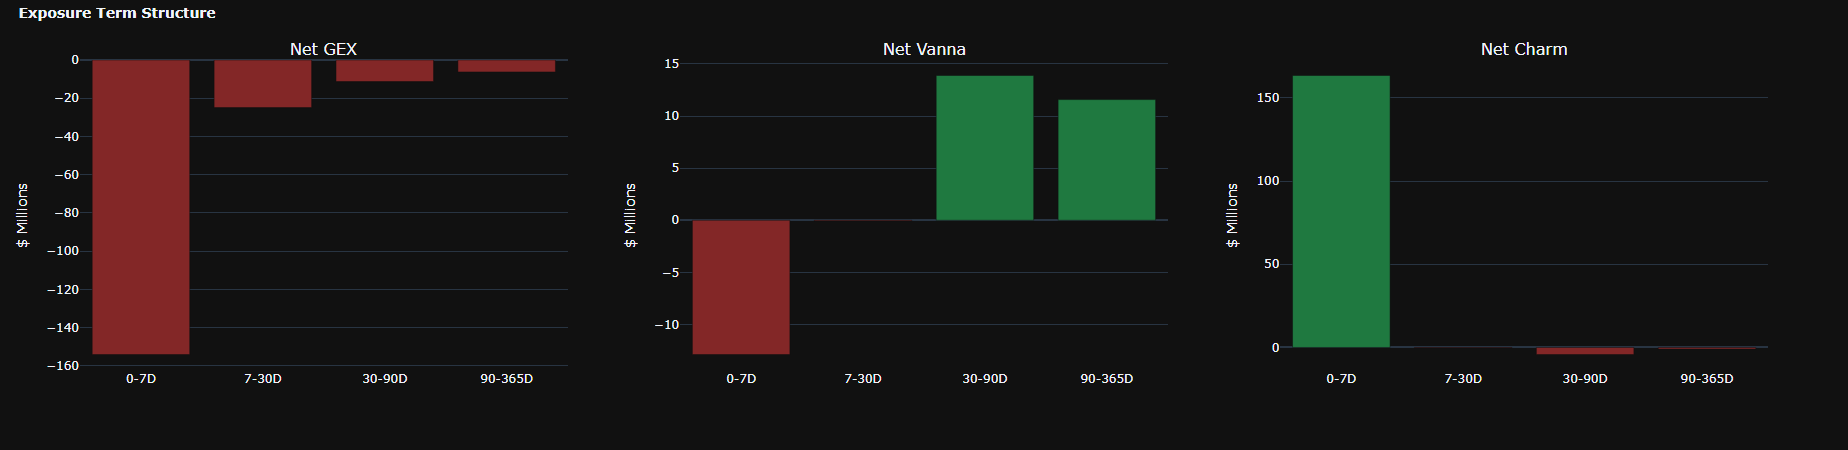
Exposure Term Structure

29 · Exposure Term StructureAdvanced Analytics
Screenshot of Exposure Term StructureEnlarge×
What it shows
Passive-side Net GEX, Net Vanna and Net Charm grouped into expiry buckets 0-7D, 7-30D, 30-90D, 90-365D, 365D+.
How to read it
Shows which maturities hold the risk; buckets run from near to far. At capture, for example: a large negative Net GEX in 0-7D (≈ −$153M) and a large positive Net Charm in 0-7D — short-dated positions dominate and will change fast as near expiries roll off.
How it is calculated
Net GEX, Net Vanna and Net Charm weighted by the Long − Short position, passive side's sign, summed by days-to-expiry bucket. Units: GEX $M per 1% price move, Vanna $M per vol point, Charm $M per day.
Watch out for
A bucket with no contracts is not shown (usually 365D+). Buckets hold very different numbers of contracts, so compare sizes across buckets with care.

Tab · Live Chart

A real-time GC futures candle chart, overlaid with option order flow by strike, position-based OI, GEX, volume profiles and a footprint. This is where options, futures and order flow come together on one price axis.

30

Layout and navigation

30 · Layout and navigationLive Chart
Screenshot of Layout and navigationEnlarge×
What it shows
The full view: the central price area (futures candles, option bubbles, flow lines, volume profiles), the GEX panel on the right, three strips at the bottom (volume, sentiment, whale & sweep), the top toolbar and the left rail.
How to read it
Mouse wheel = zoom time; drag = pan; drag the price gutter = stretch/compress price; drag the time gutter = stretch/compress time; double-click a gutter = reset; the » button bottom-right = jump to the latest bar. The time axis is ordinal (one cell per bar), so session breaks leave no gap. All times are Chicago time. Hover any object to see its figures (turn off TIP if a tooltip covers what you are reading).
How it is calculated
CONTINUOUS mode stitches the GC expiries into one continuous series mapped to the main contract; option flow from every expiry is placed on that same price axis. Pick a specific contract (e.g. GCZ6) to see only that contract's candles and options.
Watch out for
Some layers exist only in CONTINUOUS (e.g. the Gamma-Flip Pivot). Aggregate lines (Net Delta, CVD…) use per-session scales, so read their SHAPE and do not compare heights between lines.

31

Top bar: contract, status chips, thresholds

31 · Top bar: contract, status chips, thresholdsLive Chart
Screenshot of Top bar: contract, status chips, thresholdsEnlarge×
What it shows
The contract selector; the LIVE button and status chips; the Min slider (hides small bubbles) and the Sent slider (order-size threshold for sentiment, flow totals, whale and sweep markers); the CVD, Flow tools, TIP and full-screen buttons.
How to read it
Green chips = normal. FEED = feed lag; TAPE = the trade tape is keeping up; GW = the data gateway (IDLE during the 16:00–17:00 CT break and holidays is normal); BF = whether a data gap needs filling; PACK = the latest history session loaded; MAP = contract-mapping coverage for the flow lines. The VCT chip summarises the microstructure of the last closed minute: MQ (PUSH = large flow moving price; ABSORB = large flow while price barely moves — it is being absorbed; THIN = price moving on little flow; BACKED/DIVERGENT = price with/against the flow), SRC (FUT-LED, OPT-LED, MIXED, OPPOSED = which side is driving), VR (spread width low/normal/high for the session).
How it is calculated
Min only changes what is DRAWN. Sent changes the counting: only orders at or above it enter sentiment, flow totals and whale/sweep markers.
Watch out for
VCT is descriptive, not a direction call. When a chip turns red or amber, the flow lines for that period may be incomplete — read the chip's tooltip for the reason.

32

Left rail: Session statistics

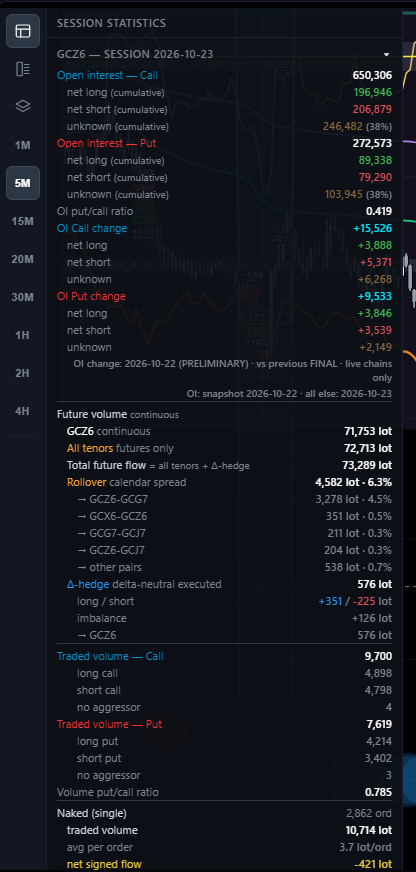
32 · Left rail: Session statisticsLive Chart
Screenshot of Left rail: Session statisticsEnlarge×
What it shows
Statistics for the session in view: call/put OI with net long, net short and unknown; OI change; futures volume (main contract, all contracts, including delta-hedge legs); roll calendar spreads; option volume by long/short call/put; naked vs spread vs delta-neutral orders; net sentiment.
How to read it
Read top to bottom: (1) OI and OI change — where positioning leans after the latest publication; (2) futures volume and the share of roll spreads — real futures flow or just rolling; (3) long/short calls/puts — what aggressors are buying or selling today; (4) naked versus spread — one-way money or hedged structures; (5) Net sentiment = net/gross, plus the delta-weighted version.
How it is calculated
Same OI, net long, net short and unknown figures as the cockpit. Spread direction follows the payoff of the whole structure; "gross signed flow" is a sum of absolute values, not volume.
Watch out for
OI is a snapshot of the latest publication (the note line states the OI session and the session of everything else). Unknown was about 38% of OI at capture.

33

Left rail: Footprint

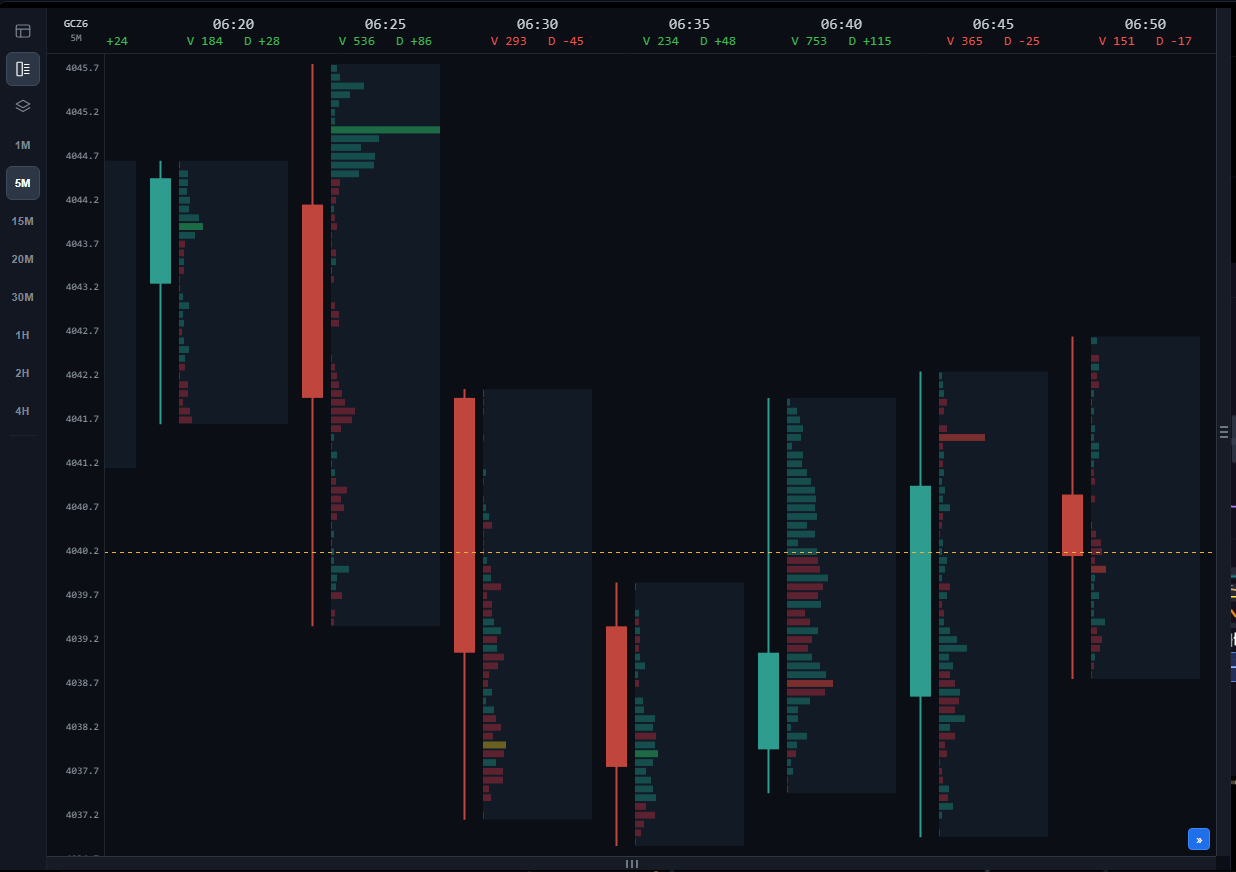
33 · Left rail: FootprintLive Chart
Screenshot of Left rail: FootprintEnlarge×
What it shows
A futures footprint for each candle: every price level inside the candle has an aggressive-buy bar (green) and an aggressive-sell bar (red); each column header shows V (candle volume) and D (delta = buys − sells).
How to read it
Look for price levels where one side clearly dominates (imbalance) and levels with heavy volume where price did not continue (absorption). Large positive delta at the top of a candle that closes low = buyers absorbed; large negative delta at the bottom of a candle that closes high = sellers absorbed. The footprint runs alongside the main chart: drag to review, » to follow the latest bar. Four zone layers (switched on at the bottom of Layers) mark imbalance, absorption and exhaustion, and flag bars that close in line with their order flow; see Reading Footprint Zones for how to read each one.
How it is calculated
Each futures trade is placed in a (candle × price) cell by aggressor side; delta = aggressive buys − aggressive sells.
Watch out for
A footprint is most useful on short timeframes (1M–15M). Read it with Cluster search (Flow tools), which marks cells whose delta clears a threshold directly on the candles.

34

Left rail: Layers

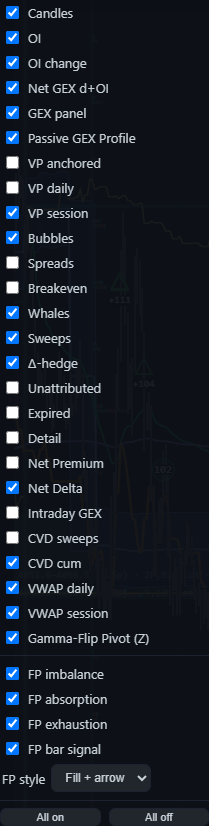
34 · Left rail: LayersLive Chart
Screenshot of Left rail: LayersEnlarge×
What it shows
The list of layers you can switch on/off, grouped as: price (Candles); positioning (OI, OI change, Net GEX d+OI, GEX panel, Passive GEX Profile); volume profiles (VP anchored, VP daily, VP session); option flow (Bubbles, Spreads, Breakeven, Whales, Sweeps, Δ-hedge, Unattributed, Expired, Detail); flow lines (Net Premium, Net Delta, Intraday GEX, CVD sweeps, CVD cum); VWAP (daily, session); Gamma-Flip Pivot (Z); footprint zones (FP imbalance, FP absorption, FP exhaustion, FP bar signal), plus the FP style selector. See Reading Footprint Zones for how to read each footprint layer.
How to read it
Start lean: Candles + VP session + VWAP + Bubbles + Net Delta. Add layers one at a time for the question you are asking, rather than switching everything on. "All on"/"All off" are at the bottom.
How it is calculated
Layers are drawn in a fixed order: Δ-hedge at the bottom, then option bubbles, positioning layers, VWAP, flow lines, CVD, volume profiles, candles, and big trades / clusters on top. That keeps candles and large-order marks readable.
Watch out for
Switching a layer off only changes what is drawn, never the totals (e.g. hiding Expired bubbles does not change Net Delta).

35

OI publish marks, OI and OI change

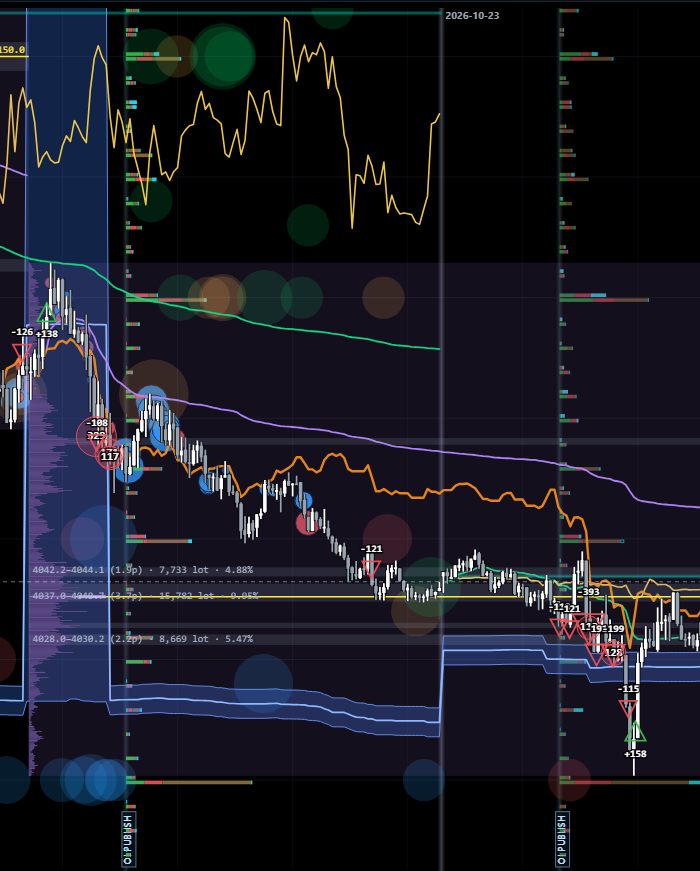
35 · OI publish marks, OI and OI changeLive Chart
Screenshot of OI publish marks, OI and OI changeEnlarge×
What it shows
"OI PUBLISH" vertical lines mark each CME OI publication. From the line, horizontal bars growing RIGHT show OI by strike; bars growing LEFT show that publication's OI change, split into what aggressive buyers and aggressive sellers opened.
How to read it
Strikes with long OI bars are large positioning zones where price often reacts. Long one-colour OI change bars right after a publication tell you which side is opening new positions at that strike. Compare the current price with these strikes.
How it is calculated
OI bar thickness follows that trading session's own OI. Option strikes are placed on the futures price axis (adjusted for the spread between contracts in CONTINUOUS mode).
Watch out for
Preliminary ~19:30 CT, final ~09:05 CT. Right after a publication the split can take a while to appear ("split pending" chip).

36

Option bubbles, whales, sweeps and Δ-hedge

36 · Option bubbles, whales, sweeps and Δ-hedgeLive Chart
Screenshot of Option bubbles, whales, sweeps and Δ-hedgeEnlarge×
What it shows
Each bubble is one option order placed at its strike (on the price axis) and fill time; size by lots; colour by the direction of the bet (green = bullish, red = bearish). Filled triangles = large single orders (whales); hollow triangles = sweep bursts (3+ fills); the small blue/red dots of the Δ-hedge layer = futures legs of delta-hedged option structures.
How to read it
Large bubbles clustering at one strike above or below price = where option money is placing its bets. Turn on Spreads to see multi-leg structures and Breakeven to see their breakeven levels. Blue Δ-hedge = futures bought alongside options, red = futures sold. Hover a bubble for the contract, side, lots, premium and delta.
How it is calculated
Direction follows the payoff of the whole structure (buying calls / selling puts = bullish). The Sent threshold decides which orders count as whales/sweeps and enter sentiment.
Watch out for
The aggressor side does not tell opening from closing. Unattributed bubbles (side unknown) are off by default. Bubbles from expired series turn grey when Expired is on.

37

GEX panel (right side)

37 · GEX panel (right side)Live Chart
Screenshot of GEX panel (right side)Enlarge×
What it shows
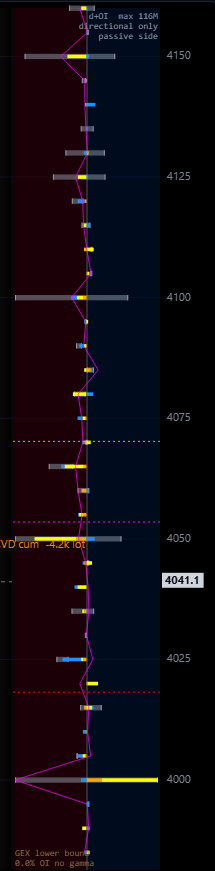
In CONTINUOUS mode the right panel shows Net GEX d+OI by strike (passive side: positive bars to the right, negative to the left), a cumulative line and the GGL / Zero GEX / Gamma flip levels.
How to read it
Read it like the cockpit's Passive GEX Profile turned on its side and aligned with the price axis: a long bar right next to the current price immediately shows the passive side's long/short gamma zone. The "directional only, passive side" label is a reminder that it shows the direction of positioning, not an absolute size.
How it is calculated
The same Long − Short position GEX as the cockpit; gamma and price update continuously, positions at each OI publication. Levels use every strike, so they do not move when you zoom.
Watch out for
The panel width is fixed in pixels (drag its left edge to change it, double-click to reset); zooming vertically stretches the bars with the strikes.

38

Volume profiles, VWAP and Gamma-Flip Pivot

38 · Volume profiles, VWAP and Gamma-Flip PivotLive Chart
Screenshot of Volume profiles, VWAP and Gamma-Flip PivotEnlarge×
What it shows
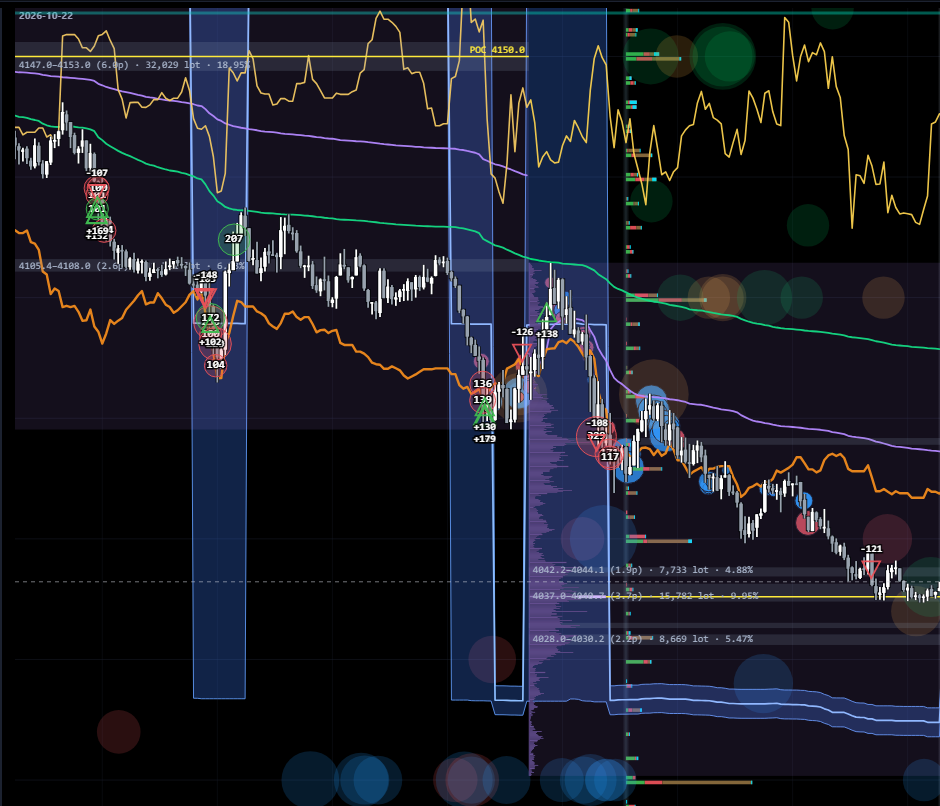
VP session (volume profile from the COMEX open at 07:20 CT to the next open, solid line = POC), VP daily (per CME session), VP anchored (segments between high-volume anchors, labelled price range · lots · share); two VWAP lines (daily resets at 17:00 CT, session runs from 07:20 CT); the blue Gamma-Flip Pivot (Z) band.
How to read it
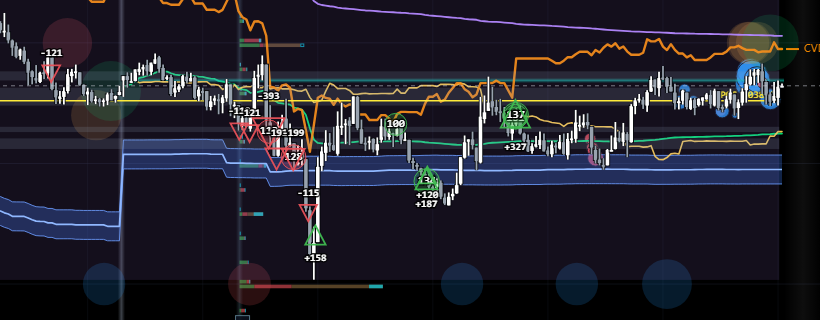
The POC and high-volume zones are where the market accepts price; leaving them with supporting flow usually means a genuine move, returning inside means rejection. Price above VWAP = session buyers are in profit on average. The Gamma-Flip Pivot band is built from the same Z series as the band on Quantum: the nearest price at which the passive side's GEX profile changes sign. It does not say which side is long gamma and which is short gamma. Read the state at price on Passive GEX Profile with Risk Zones; the bars around price in the GEX panel on the right are only a quick view, and when they disagree, go by Passive GEX Profile.
How it is calculated
VWAP = Σ(price × volume)/Σ volume of the main future. Each VP type has its own scale; VP anchored uses ONE scale for all segments, so a longer bar always means more volume.
Watch out for
Only candles and large-order marks are drawn on top of the VP. A VP anchored bar can run into the next box — that is real volume, not an error.

39

Flow tools: Big trades and Cluster search

39 · Flow tools: Big trades and Cluster searchLive Chart
Screenshot of Flow tools: Big trades and Cluster searchEnlarge×
What it shows
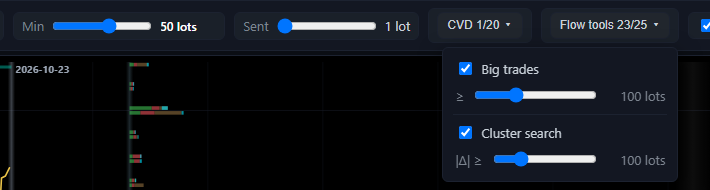
The Flow tools menu has two tools, each with its own threshold: Big trades (circles over candles) and Cluster search (triangles over candles).
How to read it
Big trades: each circle is one cumulative trade — consecutive fills at the same price, same side, within 1 second; the number is the lot total; green = buyers lifting, red = sellers hitting. Cluster search: each triangle is a footprint cell whose DELTA (not volume) clears the threshold: green up = buyers dominate, red down = sellers dominate.
How it is calculated
Cluster search filters on delta, so a cell that traded 300 lots split evenly has a delta near zero and does not show.
Watch out for
Lower thresholds give more marks but more noise; tune them to the timeframe you are viewing.

40

Bottom strips: volume, sentiment, whale & sweep

40 · Bottom strips: volume, sentiment, whale & sweepLive Chart
Screenshot of Bottom strips: volume, sentiment, whale & sweepEnlarge×
What it shows
The volume strip (bars per candle), the sentiment strip (green/red by the direction of option flow in the candle) and the whale & sweep strip (large-order and sweep triangles). Totals for the flow lines (e.g. Net Delta) sit at the right.
How to read it
Sentiment changing colour together with a volume spike = purposeful option flow; a dense one-colour whale & sweep strip confirms which side is aggressive. Check the candles above to see whether that flow actually moved price.
How it is calculated
Sentiment is weighted by volume × |delta|, with direction from the structure's payoff. Only orders at or above the Sent threshold count.
Watch out for
A Flow score strip (FUT and OPT) can be added under the whale & sweep strip: positive = flow has been running with price; the two lines use separate scales, so compare shapes, not heights.

41

CVD: sweeps and cumulative

41 · CVD: sweeps and cumulativeLive Chart
Screenshot of CVD: sweeps and cumulativeEnlarge×
What it shows
Two CVD lines for the main future, each with its own run-size threshold: CVD sweeps (red, resets each session at 17:00 CT) and CVD cum (continuous across days).
How to read it
Rising CVD = aggressive buying dominates. Price up while CVD is flat or falling = divergence, buyers are not really pushing; price down while CVD rises = aggressive buying is being absorbed by resting sell orders. Raise the threshold to see only large runs.
How it is calculated
Counts only runs of consecutive same-side aggressive trades on the main outright future (no options, no spreads); a run is cut when the other side takes over.
Watch out for
CVD cum scales to the visible window: read its shape, and do not compare its height with the CVD sweeps line.

42

Timeframes and single-contract mode

42 · Timeframes and single-contract modeLive Chart
Screenshot of Timeframes and single-contract modeEnlarge×
What it shows
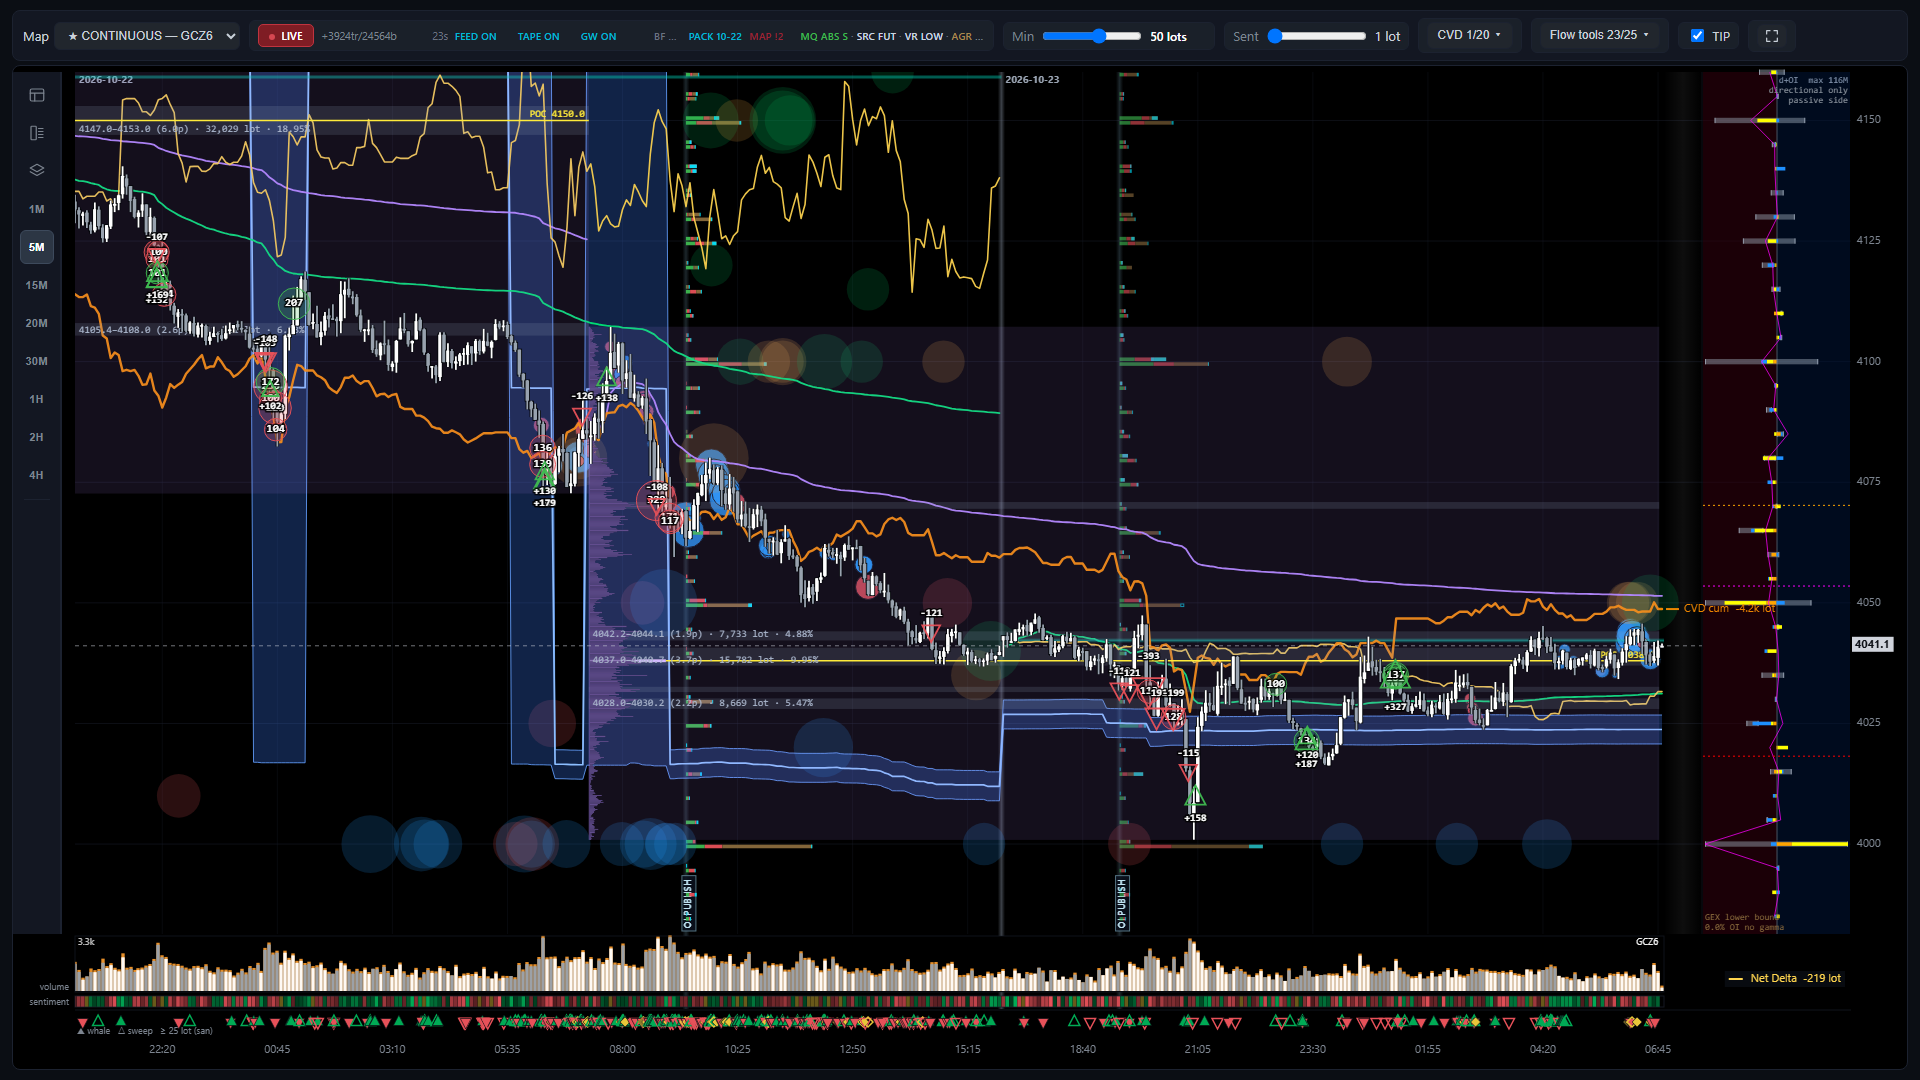
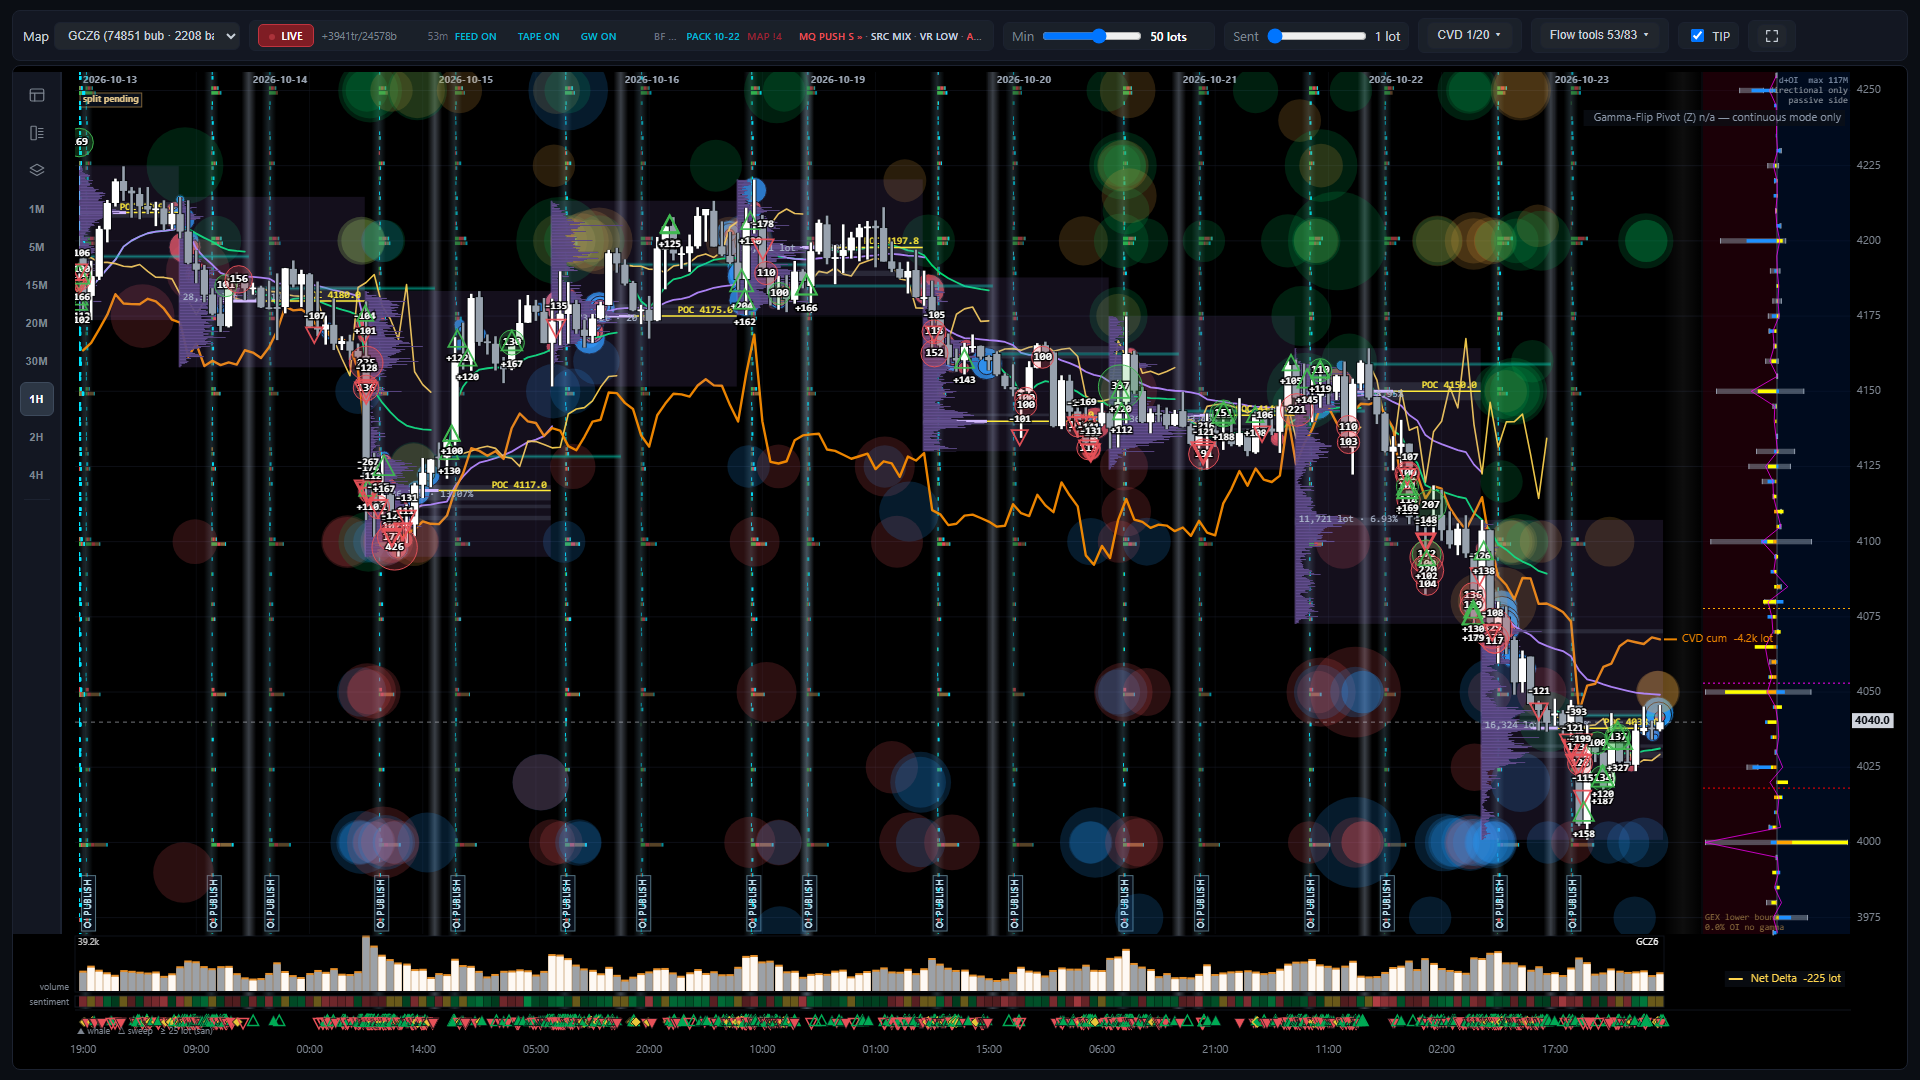
Picture: single-contract mode (GCZ6) on the 1H timeframe. The left rail has 8 timeframes 1M, 5M, 15M, 20M, 30M, 1H, 2H, 4H; the contract selector switches between CONTINUOUS and each contract.
How to read it
Large timeframes (1H–4H) show multi-day structure: VP, session VWAP, OI zones; small ones (1M–5M) suit the footprint, big trades and clusters. Single-contract mode helps when analysing that contract's options or around a roll.
How it is calculated
Changing the timeframe only re-groups candles and per-candle totals; the session's flow figures do not change.
Watch out for
The Gamma-Flip Pivot (Z) exists only in CONTINUOUS (single-contract mode shows "n/a — continuous mode only").

Daily routine

Before the COMEX open (before 07:20 CT)

  • Check Last Update in the header: is the data flowing?
  • OI Change & EOD Volume: who added positions at which strikes in the latest publication (Long or Short ΔOI).
  • OI & Volume Heatmap + Passive GEX Profile: is price inside a green (long gamma) zone, a red (short gamma) zone or an unshaded (near-balanced) stretch of the passive side; where it sits versus the Gamma Flip, Pinning Zone and the Max ±GEX stars.
  • Gold vs 10Y yields: real-yield and futures OI context.
  • Drag the calendar slider under Quantum to see economic events in the next 48 hours.

Pricing volatility (once a day)

  • Volatility Risk Premium: is IV 30D above or below RV?
  • ATM IV Term Structure + Intraday ATM IV: contango or backwardation, which expiry holds an event.
  • Volatility Cones (ATM, RR, BF): the Last line versus the cone — RICH or CHEAP at the maturity you plan to trade.
  • Wing z-score map + Smile vs history: where (delta, expiry) the smile's skew (RR) and convexity (BF) deviate unusually from history.

During the session

  • Net Delta: is aggressive option delta flow rising, falling or flat within the session? Net Premium: is more premium being paid by aggressive buyers or collected by aggressive sellers, and which group has the largest flow?
  • Intraday Net GEX: are customers buying or selling gamma today?
  • Quantum: distance from price to the Gamma-Flip band and the OI walls; price crossing the band or the band stepping ⇒ check the green/red zones on Passive GEX Profile again; CUSUM/flow-burst markers show when the flow rhythm changes.
  • Intraday RR / BF: how skew reacts as price moves (RR falling fast as price drops = insurance demand).

Near expiry, late in the day, before weekends

  • Exposure Term Structure: is risk concentrated in 0-7D?
  • Vanna & Charm Risk Profile + Intraday Net Vanna & Charm: hedging flows from time (charm) and IV (vanna).
  • Color: how the gamma profile will shift overnight.

After each CME OI publication (~19:30 CT preliminary, ~09:05 CT final)

  • Charts using (L − S) step to new values: Passive GEX, Aggressor d+OI GEX, Quantum Z, the rest of the Advanced tab.
  • Re-read the green/red zones around price, the Gamma Flip and Max ±GEX; compare the new ΔOI with the previous session's flow.

Combining the charts

"Sticky" price zones versus "slippery" ones

Price inside a green zone of Passive GEX Profile with the zone's edges well away from price, large green bars around it and a Pinning Zone close by; on Quantum the Gamma-Flip band also well away from price ⇒ a passive long-gamma context: their hedging tends to hold the range. Conversely, price inside a red zone with orange negative bars around it ⇒ hedging goes with the move and volatility extends more easily. The farther the zone's edges are from price, the less likely a short move is to change that state; a distant Gamma-Flip band only corroborates this, and when it disagrees with the zone edges, go by Passive GEX Profile.

Limits: Unknown is about 38% of OI, so the sign of the total is conditional; use it as context, not an entry signal.

Reading Net Delta and Net Premium together

Set Net Delta beside price to see whether, over the same stretch, aggressive option delta flow was rising, falling or roughly flat. Net Premium adds the net cash: a positive, rising yellow line ⇒ since the open, premium paid by aggressive buyers exceeds what aggressive sellers collect; negative and falling ⇒ the reverse. That net part is usually small next to each group, so look at all four groups LC, SC, LP, SP to see which one has the largest flow. Moving with or against price only describes what happened at the same time; it is not a cause or a forecast of price.

Limits: The aggressor side does not separate opening from closing; check OI Change after the next publication. This is descriptive context, not an entry signal.

Choosing structures from the price of volatility

Large positive VRP + Cones ATM near the top (RICH) ⇒ the LEVEL of volatility is priced high versus both realized volatility and its own history. Negative VRP + Cones ATM CHEAP ⇒ the reverse. Read the smile's SHAPE separately: the Wing z-score map shows where skew (RR) and convexity (BF) deviate unusually — e.g. RR CHEAP means puts are priced above calls by more than usual, BF RICH means wings are expensive relative to ATM by more than usual. Smile vs history checks whether that point really sits outside its distribution.

Limits: Cones and the Wing map are based on earlier settlements; check Intraday RR/BF/ATM for today's changes.

Time risk around expiry

Exposure Term Structure concentrated in 0-7D + large Net Charm + large Color around ATM ⇒ the hedging profile will change fast overnight and in the last hour before 12:30 CT on expiry day. Large Vanna before an event ⇒ an IV drop after the event also creates hedging flow.

Limits: The simulation keeps IV fixed per strike; when skew shifts strongly, the real size differs.

Advanced analysis on the Live Chart: options + futures + footprint

Absorption at an option positioning zone

Price reaches a strike with a long OI bar or a large positive GEX bar in the right panel, inside a high-volume VP zone. The footprint shows large delta at that level but the candle does not follow through; the VCT chip shows MQ ABSORB; CVD rises or falls while price stalls. Option bubbles show which side is betting at that strike.

Limits: Absorption shows there is opposing interest; it does not tell you how long it will hold.

Leaving a zone with supporting flow

Price leaves the session VP value area and crosses VWAP; CVD sweeps and Net Delta move the same way; VCT shows MQ PUSH with SRC MIXED; Big trades and Cluster search marks appear in the direction of the move; option bubbles and the sentiment strip share its colour. When several independent layers agree, real money is behind the move.

Limits: Check the gamma state at price on Passive GEX Profile with Risk Zones: with price inside a red zone (the passive side short gamma), moves tend to extend more easily. The GEX panel on the right gives a quick view; when the two disagree, go by Passive GEX Profile. Being above or below the Gamma-Flip Pivot does not tell you this.

Who is leading: futures or options

VCT SRC FUT-LED with a steep CVD and a flat Net Delta = futures are leading. SRC OPT-LED with Net Delta moving, dense bubbles and the Δ-hedge layer appearing = option flow is leading, with futures hedges. SRC OPPOSED = the two markets push against each other — be wary of one-sided readings.

Limits: Δ-hedge is futures legs tied to options, not free-standing futures flow; Session statistics shows its share of total futures volume.

Re-reading positioning after each OI publication

At an OI PUBLISH line: see at which strikes the OI change bars grow left and whether aggressive buyers or sellers opened them; cross-check Session statistics (net long/short calls/puts) and the GEX panel (did the Gamma flip move?). Over the following sessions, watch how price reacts when it reaches the newly added strikes.

Limits: Unknown is about 38% of OI: use it as context, not as the whole market's positioning.

Rolls and choosing the contract

Session statistics shows the share of roll calendar spreads in futures volume; a high share = much of the volume is rolling, not directional flow. Switch to single-contract mode to see the new contract's own candles and options once liquidity has moved.

Limits: CONTINUOUS stitches contract prices together; around roll days, comparing prices across two contracts needs the spread between them.

Screenshots show the state at one moment; cockpit figures change with the market. This guide explains how to read the charts and is not trading advice.