- What it shows
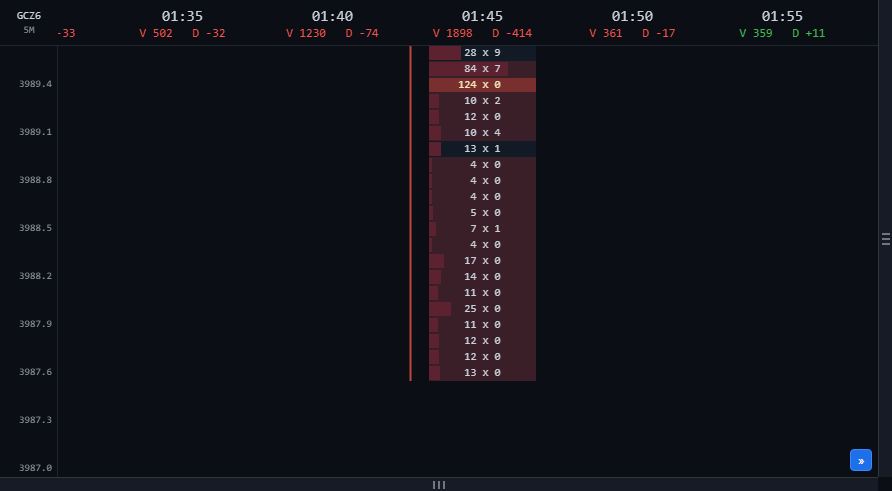
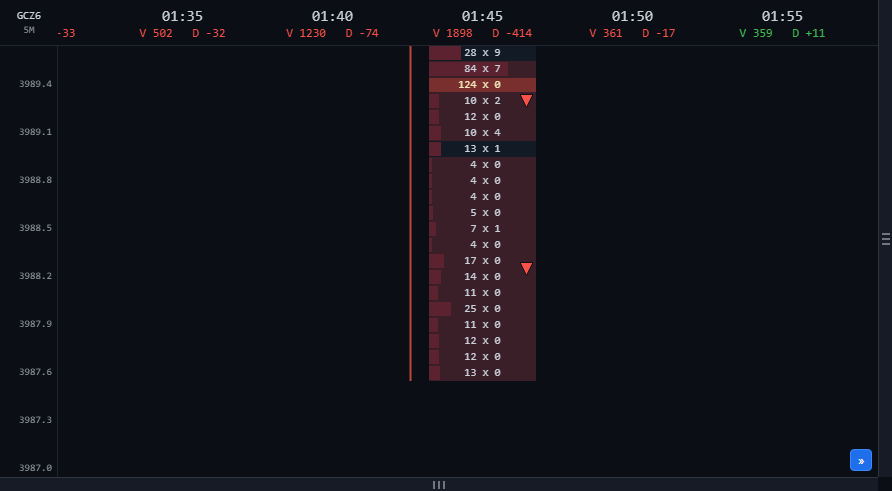
- A colour band across the bar's cells at consecutive price levels where one side dominates. Green: buyers dominate inside an up bar. Red: sellers dominate inside a down bar. The arrow on the right edge shows the direction.
- How to read it
- A green zone in the lower half of an up bar shows where buyers actively pushed price up; it is often watched as support when price comes back. A red zone in the upper half of a down bar is the mirror case, often watched as resistance. Several same-colour zones stacked in one bar (as in the screenshot) mean sustained one-way pressure.
- How it is calculated
- A diagonal comparison, as on a standard footprint: aggressive buying at a price is compared with aggressive selling one level below (a market buy lifts the ask, one tick above the bid); aggressive selling at a price is compared with aggressive buying one level above. A level counts as imbalanced when the dominant side is at least 4 times (400%) the other side. A zero on the other side still counts. A zone is 3 or more consecutive price levels. A zone is only coloured when its direction matches the bar (green in an up bar, red in a down bar).
- Watch out for
- Because a zero on the other side still counts, thin levels at the bar's tail (for example 8 × 0, 5 × 0, 5 × 0) easily form long zones. That is real one-way pressure but thin: read it together with the volume in the cells. Zones on the bar still forming can change until it closes.
Reading Footprint Zones
Four marker layers on the Footprint panel show at a glance where one side dominates, where pressure is absorbed, where it runs out, and which bars close in line with their order flow.
All times are Chicago time (CT). The footprint records traded volume at each price inside a bar: the left number is aggressive selling (market orders filled at the bid), the right number is aggressive buying (market orders filled at the ask). The zone layers describe order flow that already happened; they are not entry signals.
1 · Turning zones on and choosing a style
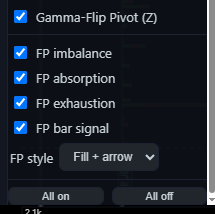
Open the Footprint panel from the left rail. The four switches and the style selector sit at the bottom of the Layers panel; All on / All off applies to them too.
Fill
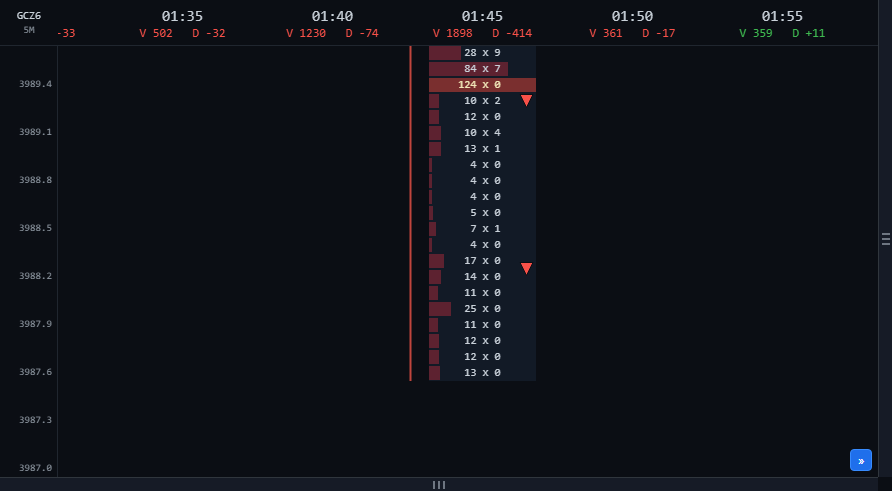
Colour band only. Useful when you want to read the cell numbers and still see the zone.
Fill + arrow
Default. Colour band plus a small arrow on the right edge of the cells, pointing the zone's direction.
Arrow
Arrow only. Useful when zoomed out over many bars.
The whole-bar signal arrow does not depend on the style; it is switched by FP bar signal.
2 · Legend
| Mark | Name | Condition | Meaning |
|---|---|---|---|
| Buy imbalance | 3+ consecutive price levels where buying dominates selling on the diagonal, inside an up bar | Aggressive buyers drove price and the bar confirmed it | |
| Sell imbalance | 3+ consecutive price levels where selling dominates buying on the diagonal, inside a down bar | Aggressive sellers drove price and the bar confirmed it | |
| Absorption | One side trades heavily but the bar closes the other way, beyond the zone | Resting orders on the other side soaked up the aggressive flow | |
| Exhaustion | Aggressive volume fades over 3 levels into the bar high or low | The side pushing price runs out at the extreme | |
| / | Bar signal | A closed bar that moved in the same direction as its imbalance zone | The bar finished in line with its order flow |
3 · Imbalance zones (green / red)
Switched by FP imbalance.
4 · Absorption zones (orange)
Switched by FP absorption.
- What it shows
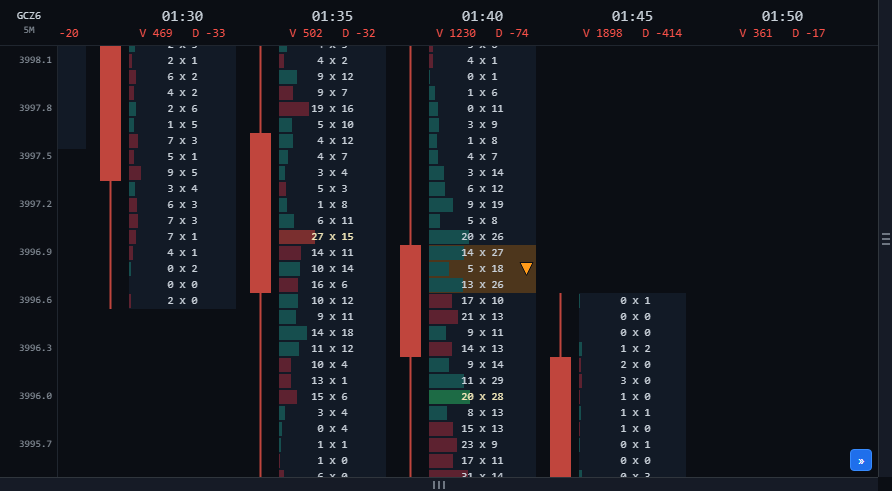
- An orange band at consecutive price levels where one side traded heavily with market orders, yet by the close the bar had moved the other way. The arrow shows where price went: up when selling was absorbed, down when buying was absorbed.
- How to read it
- Screenshot: the 01:40 bar has three levels of heavy aggressive buying (27, 18, 26 lots) against much less selling, yet the bar closed down, below the zone. Resting sell orders soaked up all of that buying. An absorption zone often marks where the passive side had large orders waiting; when price returns to it, that side may still be there.
- How it is calculated
- Absorption is measured by volume, separately from imbalance. A level counts as "heavy" when one side's aggressive volume is among the largest in that same bar and clearly exceeds the other side. It takes 3 or more consecutive heavy levels, and the bar must close the other way, beyond the whole zone. The "heavy" bar adjusts to the timeframe: higher timeframes are stricter than lower ones.
- Watch out for
- Absorption is only confirmed when the bar closes. On the bar still forming, an orange zone can appear and then disappear if price trades back through it.
5 · Exhaustion zones (grey)
Switched by FP exhaustion.
- What it shows
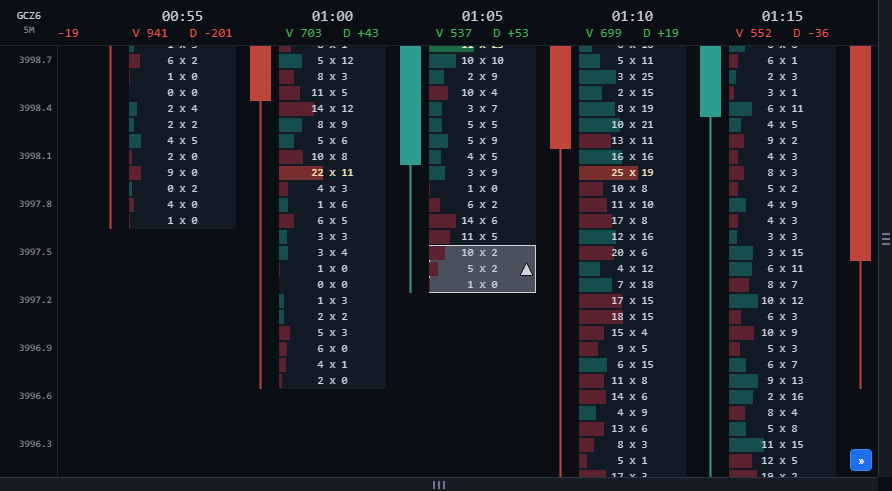
- A light grey, outlined band on the 3 price levels at the bar's high or low. The grey is drawn above the footprint background and above the other zones.
- How to read it
- At the low: aggressive selling fades as price goes down and is close to zero at the lowest level (screenshot: 10, 5, 1 lots on the 01:05 bar), meaning sellers no longer want to sell lower; the arrow points up. At the high: aggressive buying fades into the highest level; the arrow points down. Exhaustion often shows up at short-term turning points, especially when the next bar moves the other way.
- How it is calculated
- The aggressive volume of the side pushing price falls steadily over 3 consecutive levels into the extreme, and the extreme level is only a small fraction of the level two ticks away. Bars with very little volume are skipped.
- Watch out for
- Exhaustion on a single bar is a weak sign. Look for confirmation from absorption or an opposite imbalance on the next bar.
6 · Bar signal arrows
Switched by FP bar signal.
- What it shows
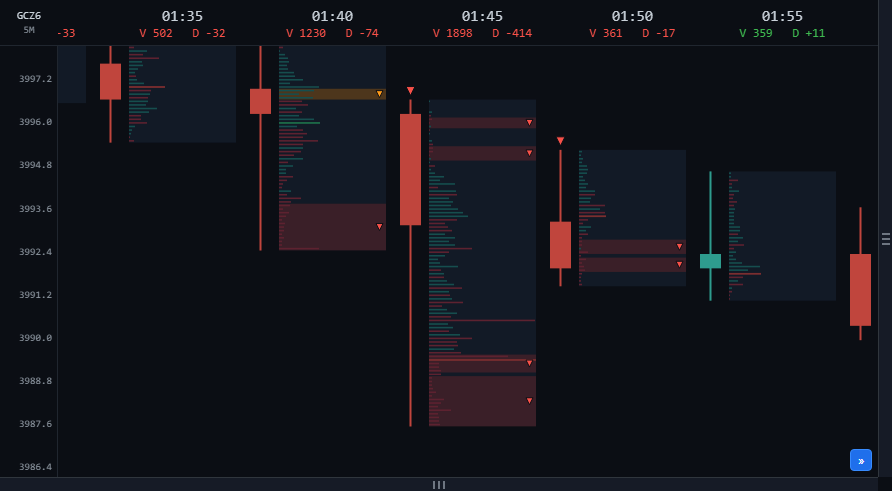
- A large arrow in the candle lane (left of the cells): green, pointing up, placed below the bar; red, pointing down, placed above the bar.
- How to read it
- Green arrow: the bar closed up and contains at least one buy imbalance zone, or a buy zone plus buying-side absorption. Red arrow: the mirror case. Screenshot: the 01:45 bar closed down with several red zones, so it carries a red arrow above its high. It summarises the whole bar: the flow inside and the bar's result point the same way.
- How it is calculated
- Only closed bars are considered. The bar still forming never gets this arrow, so it does not appear and vanish mid-bar.
- Watch out for
- On low timeframes the arrows are frequent. Give more weight to arrows at important levels (VWAP, the volume-profile POC, large OI levels) or in line with a higher timeframe.
7 · Reading one bar, step by step
1Bar result
Up or down, where it closed in its range, V and D in the column header.
2Imbalance zones
Where they sit in the bar. A zone at the root of the bar (lower half of an up bar, upper half of a down bar) is where the push started; a zone at the head is flow chasing price.
3Absorption
Is there an orange zone, and does its direction agree with the imbalance zones?
4Extremes
Is there a grey zone at the high or low? Exhaustion at the head of the bar, against its direction, is an early warning.
5Bar signal
Is there an arrow, and does the next bar follow through?
6Cross-check
Look at the same price area on the main chart (Big trades, Cluster search, VWAP, volume profile) and on a higher timeframe.
8 · Common situations
Strong continuation
An up bar with a green zone at its root, a green arrow, and no grey zone at the high of the next bar: buyers are in control, and the green zone is the level to watch when price comes back.
Limits: If price trades back through the green zone and closes below it, the zone no longer holds.
Absorption at an extreme
An orange zone at the low of an up bar (heavy selling yet price rose) plus a grey zone at the same low: sellers both ran out and were soaked up by resting buy orders. This is the clearest reversal pattern among the four layers.
Limits: The next bar needs to hold above the zone; a single bar can be noise.
Chasing without result
Several green zones crowd the top of an up bar, with a grey zone right at the high: buyers chased price and ran out of steam at the extreme.
Limits: Common at the end of a long up-move; check a higher timeframe before drawing conclusions.
An opposing zone left uncoloured
A sell imbalance zone inside an up bar is not coloured red. If that selling was heavy and the bar closed above it, the absorption layer colours it orange; if it was thin, no layer colours it.
Limits: No colour does not mean no orders: the cells still show every number.
9 · Limits
- The layers describe filled order flow; they do not forecast price and are not trading advice.
- The footprint belongs to one futures contract (shown at the top left of the panel) and only includes trades in that contract.
- In thin sessions (for example the Asian session), volume per level is small, so zones form more easily and mean less.
- Zone density differs between timeframes. When you change timeframe, re-assess rather than keep the same reading.
- Zones on the bar still forming can change with every update; only a closed bar is final.
Screenshots show the state at one moment (GCZ6 contract, 5-minute bars, 30 Oct, Chicago time). This guide explains how to read the chart and is not trading advice.